
USDCAD has been up and down on the day. The last leg today, has been down. Having said that, the pair is testing support against the high from September 3rd, the lower channel trend line (bull flag), and is in between the 38.2%-50% of the move up from September 4 low (see hourly chart below). So in an up and down day, the pair is currently at support.
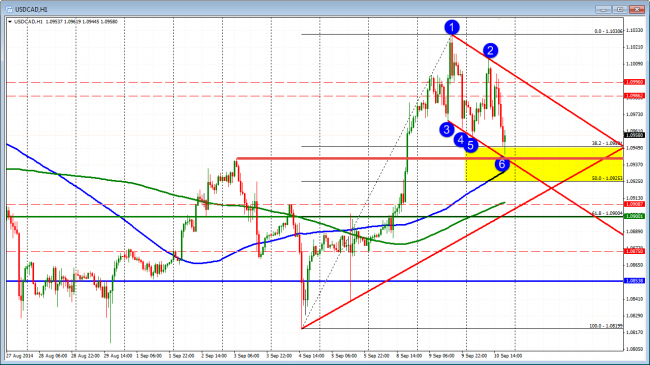
The USDCAD on the hourly chart shows the up and down volatility. Testing support on the downside.
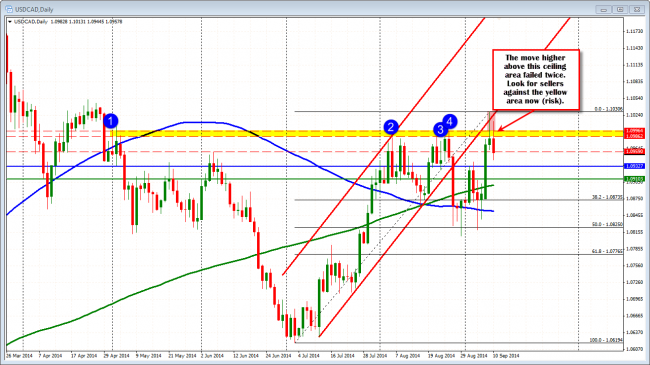
The daily chart shows more bearishness which may limit upside. The pair has moved above the 1.0986-96 area which encompasses a number of highs going back to May 2014. The last two trading days has seen the price move above those levels to the high of 1.1030. However, yesterday the price could not close above the area, and today the risk is also that the price fails to close above the levels.
So there is a bull flag on the hourly. There is some reluctance above against the 1.0986-96. One way to play it is to buy against channel trend line. Stay above, Good. On a move higher, sell against the 1.0986-96 area and see what happens there. On a break, go with it. Makes sense to me if you are a USDCAD junkie.
The USDCAD on the hourly chart shows the up and down volatility. Testing support on the downside.

