The hourly chart of the EURUSD is showing price action this week that is getting more and more narrow, with some strength and then some weakness (from a technical perspective). Looking at the action since last Friday, when the sting from the ECB decision started to slow, here is a score sheet of where we stand right now.
- The EURUSD is higher on the day (at 1.29156). PLUS
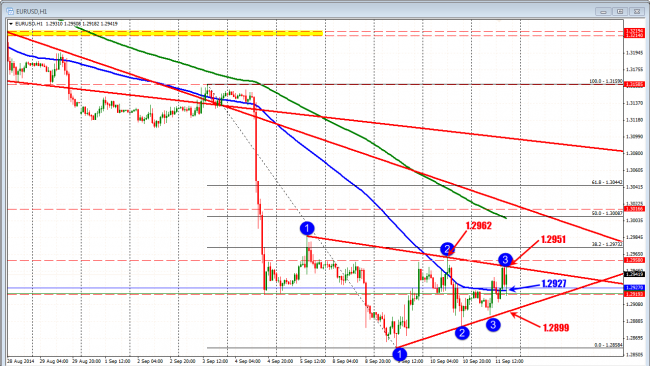
- The price is currently above the 100 hour MA (blue line in the chart below at 1.2927. PLUS
- It held bottom trend line support (currently at 1.2899). PLUS
- It held topside trend line resistance (currently at 1.2951. MINUS
- It is below the high for the week at 1.2962. MINUS
- The range for the week remains at a small 103 pips. LOOK FOR A BREAK???
- We most recently bottomed at 1.29182. The low from last Thursday/Friday was 1.2919/21 PLUS
Looking at it (and my focus is on this chart/this week), the PLUSES are more than the MINUSES. It does not guarantee a thing, but that is what I see and assume – so does the market.