
Earlier I outlined the case for a lower USDCAD (SEE PRIOR POST BY CLICKING HERE) . The price of the pair had moved below the head and shoulder neckline, and the 100 hour MA (blue line in the chart below). The price stayed below those levels and have gotten another push lower on more positive comments from BOC Poloz and the US dollars overall selling.
The low has reached a key target area against the 200 hour moving average (green line in the chart below) and the trend line connecting lows going back to September 4 and 5th. There is support against this area. However, looking at the trend move lower today, it makes sense to keep the short as long as a price remains below the 1.1004 level.
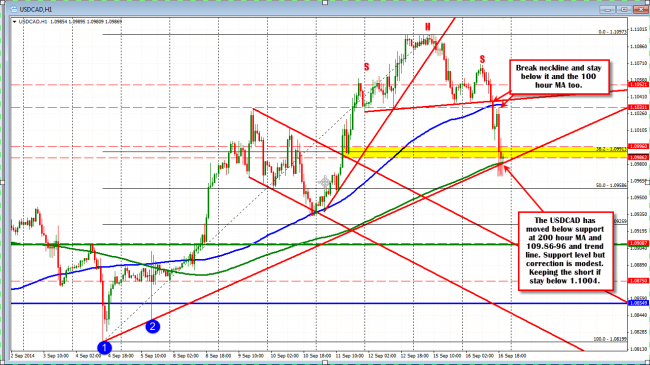
USDCAD has continued the trend move lower and tested support against 200 hour MA and trend line support. Get back below and the trend can continue.
Looking at the 5 minute chart below,the move lower today has been trend like. The corrections have been shallow. This is indicative of a market that is comfortable being short. The yellow area in the chart below is where if the price can stay below, the sellers will remain in control and the trend lower can continue. The 50% retracement level, the prior low from earlier today, the corrective high off the last low all come in around this area. Stay below, and there should be further downside potential for the pair. The 1.0958 level is the 50% retracement of the move higher in September. This is the next key target on the downside and would be a nice level to call it a day (for now at least).
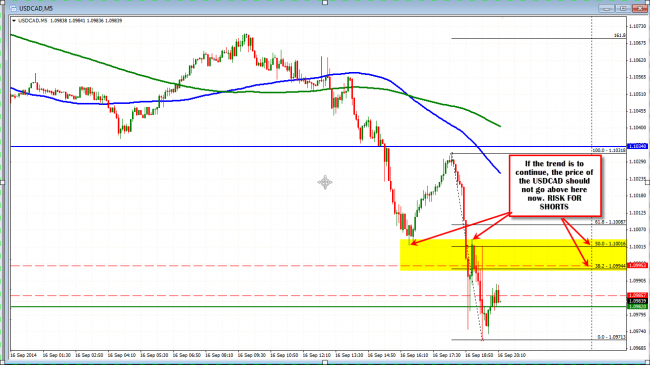
On the 5 minute chart the trend lower is progressing . Stay below the prior low, the correction high, the 38-2-50% retracement, and sellers (and the trend) remain in control.

