
Taming a savage beast like TSLA (and the forex market) by defining and limiting risk
RE-POSTED from last night:
Remember the post from a few weeks ago after Elon Musk said TSLA was too high. Well, I thought I would revisit that post and see what exactly happened.
At the time (September 5th), I did a technical analysis of the stock using the tools I use in on ForexLive.com. Specifically, moving averages (I use 100 and 200 for forex but do add a 50 day MA for stocks), trend lines and Fibonacci Retracements. That’s it. No need to get too complicated.
I figured if the CEO and head guy at TSLA thinks the price is to high, where might “smart buyers” like it on a dip. Remember, he didn’t say, his company is no good. He just thought the stock was too high.
From my analysis (not to my surprise)I saw and demonstrated that TSLA traded like the USDJPY or EURUSD. Traders in the stock, used easy to see, well used, technical tools to define and limit risk. By doing so, they were able to tame the wildest of beasts – TSLA.
Elon Musk says Tesla is too high now. What does the price and tools tell me?
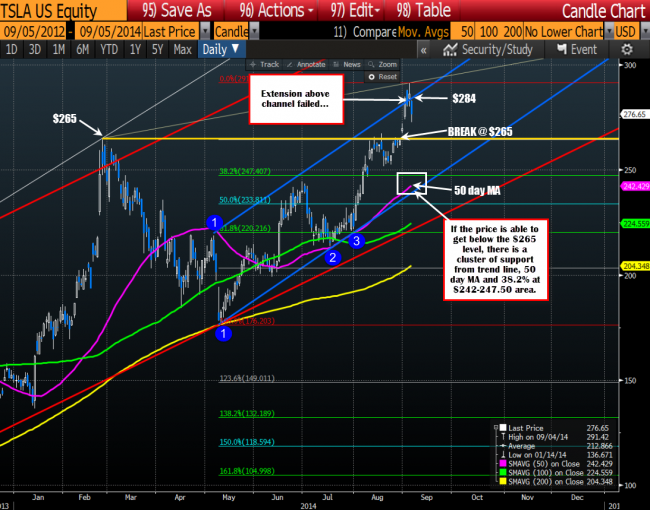
Above is the chart from the analysis done on that day (you can go and look for yourself). The price at the time of the analysis was 276.65.
On that day, I wrote the following:
Looking at the daily chart the first support target becomes the $265 break level. The market gapped above this level just last week. Where there is a gap to fill, that creates the obvious first target.
Is $265 enough?
It might be, but we were just there last week. So let’s be more patient and look for a lower level to stick our toe in the TSLA water.
On a break below that level, traders will likely next be looking to buy in the $242.00 to $247.50 area. This is where the 50 day MA (the top purple line is found), trend line support ( blue trend line), and is between the 38.2-50% retracement area of the move up from the May 2014 low. This cluster of support should be nice level for traders to buy with a stop below the 50% area at $233.81.
A move to this area would represent a decline of 14.9% – 16% from the high to the area. It sounds like a lot but given the 65% run up, maybe not if traders got a little offside. Plus, we were last there just a month ago, so again, it is not out of the question.
That was then, and this is now…
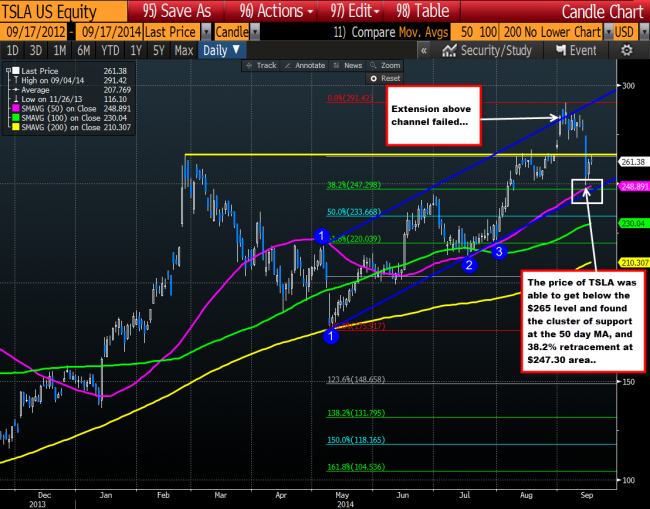
TSLA bottomed at 249.13 on Monday. The 50 day MA was at 247.28 and the 38.2% remained at 247.298.
After a few days of consolidation (post September 5) that took the price last week to what should have been channel resistance at $285 (it rallied in the face of Elon Musk’s comments – he probably sold), the share price did start a move sharply lower.
In the process, the price moved below the $265 level (that gap level) and continued down to test the 50 day MA and the 38.2% retracement (at the $247.30 area) and the channel trend line just below that (see chart above). The low came in at 249.13 on Monday – $1.80 or so away from the strong support at the 50 day and Fibonacci Retracement at $247.30. Buyers came in there. After all, risk was defined and limited against strong support levels.
The price of TSLA traded to a high of 264.70 today – just below the $265 break level.
The lesson I wrote in the post back on September 5th, was the following:
The lesson is, that smart traders in all markets will look to use technical tools to define and limit risk. If you do too, you may find that you can not only define and limit risk, but may also be able to improve trade location – even in those high flyers like TSLA.
It is all about RISK. Look for dip against the risk defining levels. They tend to find other “smart” traders, looking to do the same thing.
So, be a “smart trader”. You don’t have to be complicated, just use common sense. Define your risk. Limit your risk. Use tools that I can see, you can see, Elon Musk might even see it. If you do, you will find that you might be able to tame a wild beast like TSLA or even the forex market.
Good fortune with ALL your trading.

