
The vote was a resounding “No” the price went up but the GBPUSD is now down on the day. What happened and what now?
The GBPUSD has rotated back down in trading post the results of the Scotland vote (and is trading at new lows as I type) The cliches “Buy the rumor. Sell the fact” and “It was priced in” will be bantered about today in the press on the business channels on blogs in commentaries. For me it was the price action and the risk levels which has contributed to the decline. Let’s review and learn, then look at what is next. The GBPUSD ran above topside channel trend line at 1.6421 (at blue circle 1), the old March 2014 low price at 1.6461 level(at 2), 38.2% of the move down from the 2014 high at 1.6486 (remember this level at 3) but fell short of the next targets against the 1.6535-50 area (see prior post at by CLICKING HERE) . The pair has since moved below each of these levels and currently is trading at the lows for the days. What happened. Why the sharp selloff?
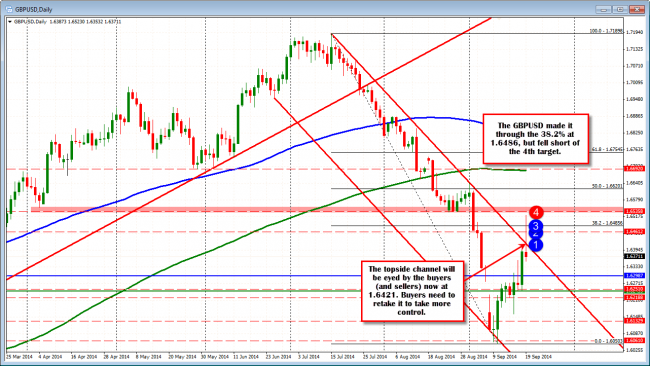
GBPUSD back into the channel.
The 5 minute chart shows the action in greater detail. All was going well for the bulls as the results of the vote were awaited, and then started to come out. Just prior to the first results, the price came up to the 1.6461 level (to 1.6457) and held. Remember this was the low from March 2014 and the 2nd target on the daily chart. After the first “NO” was announced, the first break above the 1.6461 level occurred and the high was made. All is good with the buyers. The bulls were in firmer control. The subsequent correction action (remember the big districts were yet to report) of the the initial high found buyers against the 1.6461 (good hold) and near the 50% of the last leg higher (yellow area in the chart). Buyers remained in control. Soon after a string of “No’s” came out from bigger districts, the double top was made (see chart). The failure to take out the prior high was warning number 1 that the buyers were having issues. The subsequent move lower (to the 200 bar MA – green line in the chart below) and bounce that failed to get back above the 1.6486 level again, helped to shift the mood from buyers to sellers. Warning number 2 that the market was less bullish. The price was still above the 200 bar MA on the 5 minute chart though. The rest of the decline was helped after the breaking of the 200 bar MA on the 5 minute chart (green line in the chart below). Hindsight is 20-20 – I know, but foresight from the technical levels that are deemed important (I outlined these level in a video HERE) gave traders the bias clues as the story played out. I did not expect the fall to have taken the price to the current levels.
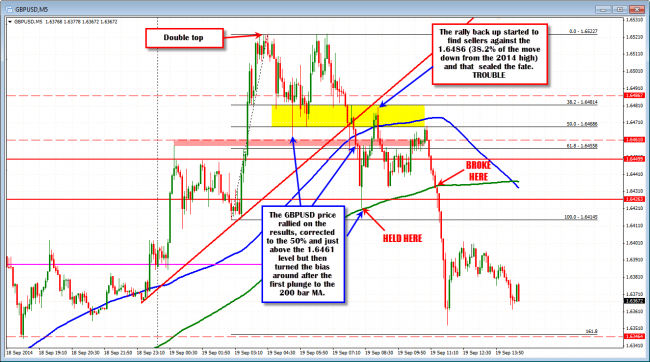
When the uncertainty is high, know your levels and watch how the price reacts on the 5 minute chart.
SO NOW WHAT? The price just fell to trend line support on the hourly chart. and is finding support buyers at 1.63198 (see hourly chart below). The 100 hour MA (blue line) is at 1.6299. This is the risk level for buyers down here. The price should find buyers against these areas. I do not expect sellers through here. It just does not make sense. The old gap low (from when the “Yes” vote started to peak, is at 1.62788. The price should not go below here too. The 50% of the move higher comes in at 1.62867. This is another support level that should provide decent support. So it is a place to buy. Where is resistance? Watch 1.6398 (this is the 38.2% of the move down today), and then the 1.6421 level – the topside trend line resistance level from the daily chart.
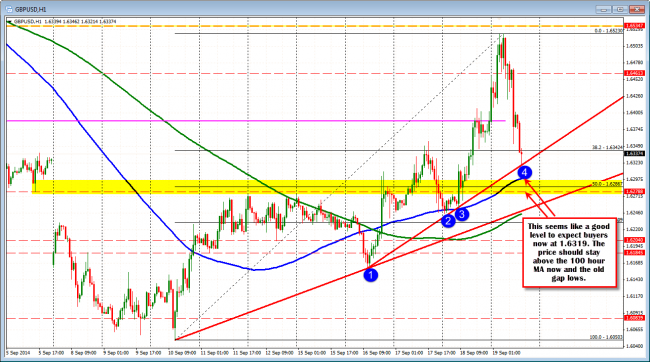
The GBPUSD has come down to trendline support now. The 100 hour MA is not far away at

