
The “No” votes have been encouraging in the early tally out of Scotland (with the larger regions still to come as I write) and the traders have not been able to curb their bullish enthusiasm. The price of the GBPUSD has – in the process – moved above channel trend line (at the 1.6420 area), the low from March 2014 at the 1.64612, The 38.2% of the move down from the July 2014 high at the 1.64856.
The next target areas at the 1.6435-51 and then up at the 1.66201 (50% of the move down from July 2014 high) have not been breached. The market is either taking a breather before the rest of the results gets tallied and reported OR has the run had enough?
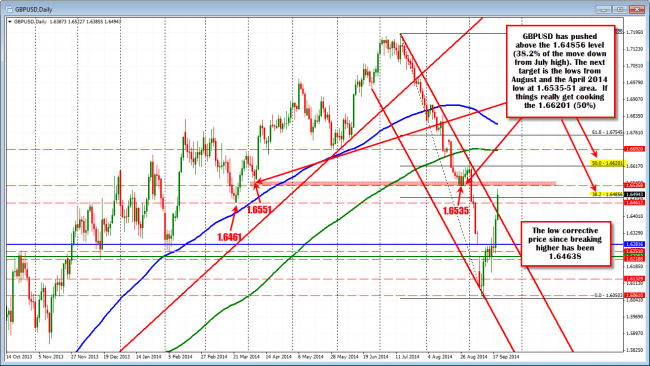
GBPUSD has moved above channel trend line and moved above 1.6461 and 1.6486. Consolidating/ correcting now as the rest of the votes make their way in.
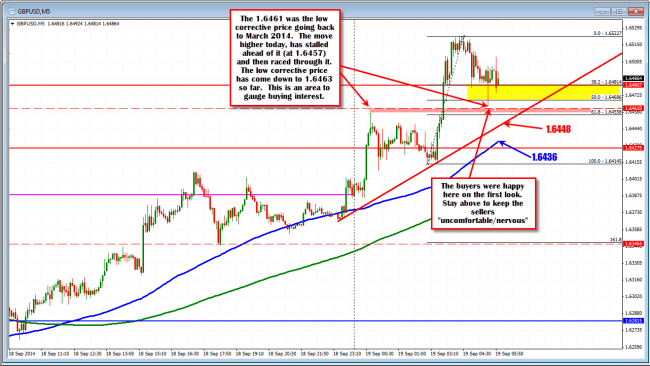
If you look at the 5 minute chart below, the bullishness from the move today (and yesterday for the matter) can be more easily seen. It also shows the support that the corrections are having.
Apart from a few dips toward the end of the NY trading day, the price has been able to stay above the 100 bar MA (blue line in the chart below and currently at 1.6436 and moving higher). This is telling should the price start to lose momentum. Move below and it may be indicative more bearishness (or correction) to come. Stay above, the buyers remain in control.
The price action around the closer 1.6461 level is also telling me something (remember this was the March 2014 low price).
Early on, before the first results, were in, the price moved up to this area and sold off (the high reached 1.6457). After the first of the result were made known, the price broke higher. There was a surge through the level. ACTION NOTED.
Also noted, is that the low correction point after reaching the peak has found, came in at 1.64638 – just above the 1.6461 level. ACTION NOTED AGAIN.
This price action is telling me that the market is using the level to lean against and define risk. Stay above, bullish. Move below, not so bullish.
Now, the story can change quickly. A “Yes” from any of the larger areas could still cause a sharp sell off. In which case watch the 100 bar MA below (blue line in the chart below) as a clue as to the markets fear/enthusiasm.
Barring one of those surprises that leads to a sharp plunge, a more orderly market with no vote surprises, could also run out of steam and lead to a “sell the fact” market. I try not to anticipate those moves because sometimes they happen and sometimes they don’t. They therefore are random (no one really knows what is priced in do they?? They just use it as an excuse afterwards)
If we do run into a “sell the fact” market the 1.6457/61 is shaping up as a close support line to pay attention to. Once again, stay above bullish. Move below bearish (at least intraday).
Absent a move below this level, the price has the potential to continue to run higher with the 1.6535-50 as my next target. If the price does extend higher, move the Fibonacci lines in the chart higher and watch for the 38.2-50% area to hold support. If there is a surge all the way to 1.6620, I would expect sellers to line up there.
Close support on the intraday GBPUSD chart comes in at 1.6457/61 now.

