
The AUDNZD has been hurt this month along with the sharp fall in the AUDUSD.
Technical Analysis: AUDNZD chart shows support at lows for the day.
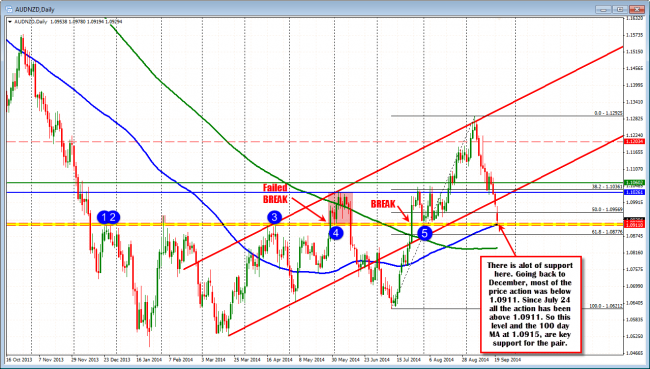
However, the pair is testing some formidable support at the 1.0911-15 area.
Looking at the daily chart above, the period from December 2013 to July 2014 saw the price trade below the 1.0911 area with the exception of a single bar in early February and a two week period at the end of May/beginning of April (see red areas in the chart above).
On July 24th the price broke above this area and the low correction price was 1.0922 – until today. Today, the low has come in at the 1.09194, just above below the low price since July, but just above the 100 day MA at the 1.09153 and the 1.0911 ceiling from earlier in the year.
This should be a pretty strong support level for the pair. Traders can lean against it with stops below and that seems to be what they are doing at the moment.
Of course, the pair is in a trend like move lower, so a move below should not be ignored but stay above and there could be a corrective move higher (for whatever reason – it might just be support held). The 1.09569 level off the daily chart is a price that will need to be breached above to help take some of the pressure off of the pair.
Looking as the shorter term 5 minute chart, at the lows you can see the buying support. What needs to be broken today, is the 100 bar MA (blue line at 1.0932). There have been two feeble attempts today to get above and both failed (this may be the 3rd). If broken, the next target will be to get above the 200 bar MA (green line) and the yellow Correction Zone of the move down from today’s high to the low (at 109.42-49 area).
There is a strong technical reason(s) to buy and risk can be defined against that area. It does not mean it will hold but it does mean that risk is defined and limited which is good enough for me. .
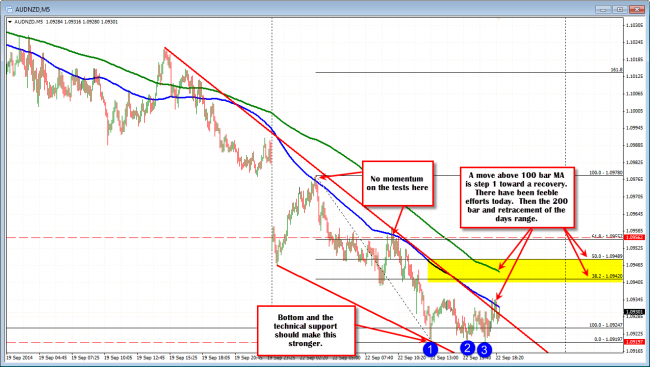
Technical Analysis: The AUDNZD needs to get above the 100 bar MA first then the Yellow area.

