
There’s a lot of long term levels showing up in various pairs that have either been broken or looking to break. It’s a timely reminder that technical levels are not made of stone but mere visual points where we look to see if a price reacts.
AUD/USD is sitting on one now.
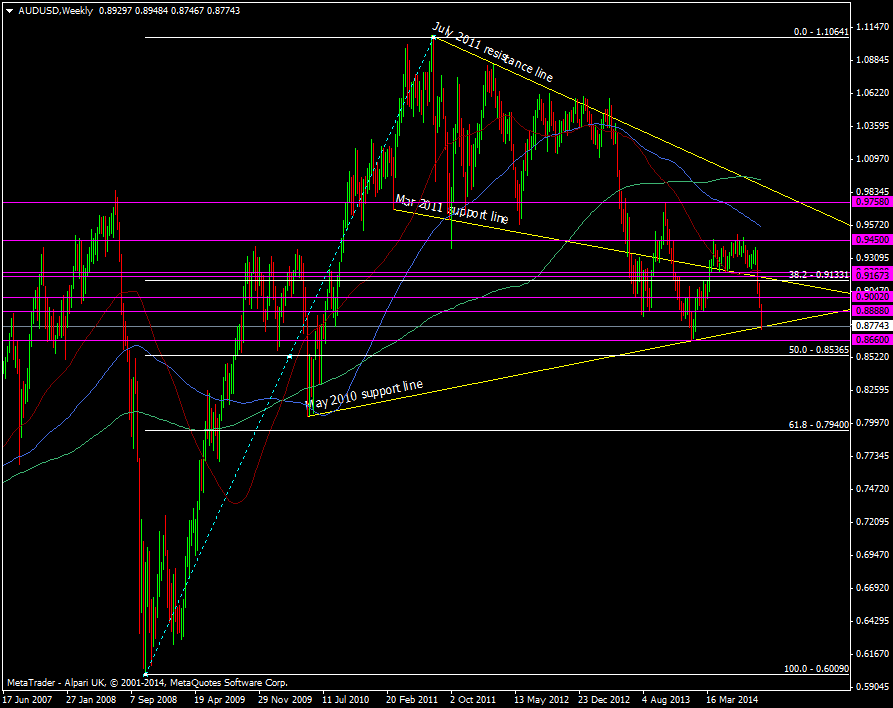
AUD/USD Weekly chart 26 09 2014
At the moment the aussie is deciding whether to close out above or below the line. Further down we have the Jan lows at 0.8660. Under that is the 50.0 fib of the 2008/2014 swing up at 0.8536. My bias is to look for a break here and trade a run down to at least the Jan low with a tight stop just above 0.8840 or above 0.8900 if you want to push it out a bit.
Every trade is different and while I had my hoover on the last time we came down here, I’m not touching longs here with a barge pole, and I’m not relying on the tech to hold up as much as I would have some time ago.
A lot of these big levels are now being carved through in a lot of USD pairs and again, touching back on what I said at the top, when we’re in a situation where we have a very very strong trend it pays to tighten up on you entry points and stop levels if going against the grain. When the US dollar gets going it is a big beast and levels that would be strong normally, can get smoked pretty easily.

