Clues to identifying a bottom from real world, real time examples
The AUDUSD has been in a free fall since the September 5th high at 0.9400. The low reached 0.8683 yesterday. Has it gone enough?
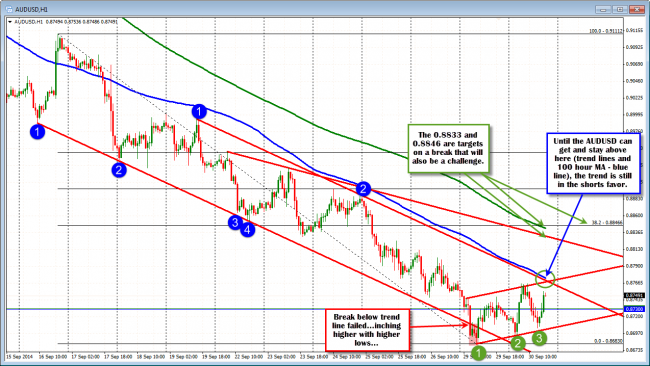
Looking at the hourly chart below, the AUDUSD fell below bottom trend line support in yesterday’s trading but could not gather any additional momentum (see red area in the chart below).

Technical Analysis: AUDUSD finds some support but key tests loom above.
Since the failed break, the price has been waffling back and forth on the hourly chart above, with slightly higher highs and higher lows. This consolidation/corrective phase has also allowed for the 100 hour moving average to catch up with the price. That moving average comes in at 0.8774 currently. There is also a topside channel trend line which comes in at the 0.8770 level. When more than one clear technical level are at a similar price level, it increases that levels importance.
If the pair has bottomed, a move above this area (and staying above) will be required to prove that the buyers are taking back some control. The price has not traded above the 100 hour moving average since September 16/17. Prior to that brief period, the price last traded above the 100 hour moving average on September 8th.
Even on break above, there will be additional technical levels to breach by the buyers before the end to the trend can be declared. The 0.8833 and 0.8846 levels (see chart above) are where a trend line and the 200 hour MA (green line) are found. The price of the AUDUSD has not traded above the 200 hour MA since the same September 8th. I would expect the first test of this moving average to find sellers.
What is the daily chart saying? Looking at the daily chart below, the speed of the decline is most evident. It also shows the reason for the pause in the trend. The low reached yesterday at the 0.8683 level got within 14 pips of the 2014 low. Traders will likely lean against that level on a test should the upside stall, with stops on a break.
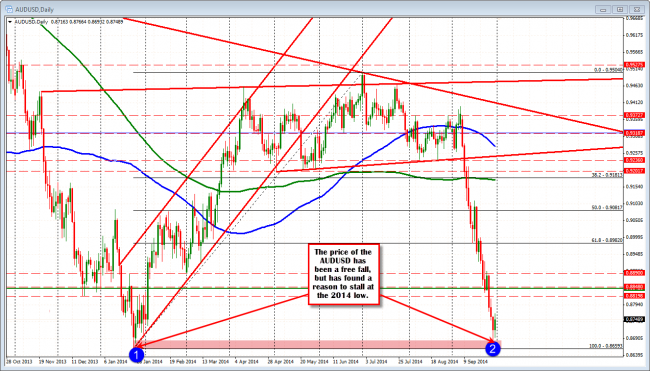
Technical Analysis: The fall has been fast and furious but traders have leaned against the low for support.
When there is good support and resistance, on the hourly and daily chart, it pays to take a look at what short term flows and price action is saying.
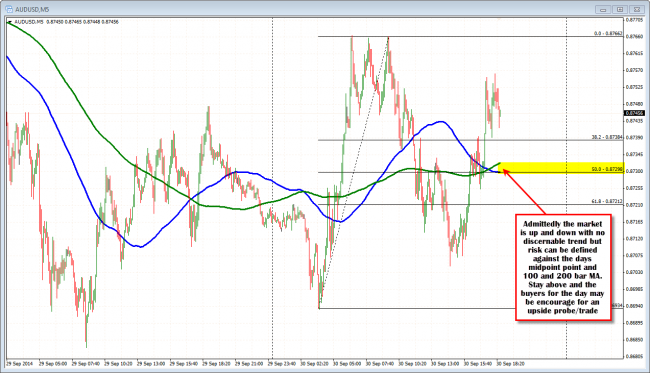
Looking at the 5 minute chart below, the price has been moving up and down in trading today. The midpoint is at the 0.8729 level. The 100 and 200 bar MA are at this area too. The price last fell below these lines but could not get to and through the recent lows. Traders who want to take a shot at the upside might look to lean against these levels and hope the price stays above. If it does, the shorter term intraday crowd would feel better about the lows and it could be enough to push toward that key hourly resistance. Risk is defined and limited.
Needless to say, the market has reached an area worthy of spending some time. Traders have a level to lean against on the downside. However, there is more work to do on any rally.
FOREX TRADING TIP: Picking a bottom often starts with some technical catalyst, that is supported by drilling down into other time period charts. The daily chart in example, provided a floor simply from a prior low. That in and of itself does not always make a bottom but it can be a start. By looking at the hourly and 5 minute chart, other supporting technical evidence may be found. If all three charts can support a potential bottom, the basis for a counter trend move might be in the works. The shorter time period charts can also be used to defined and limit risk. Traders have to keep in mind that they are trading against the trend (and this move lower is a strong trend). So respect that trend if the counter trend move does not materialize. I have seen many a perceived bottom turn around quickly and with more momentum.
The AUDUSD 5 minute chart is trying the upside again. Can support hold?
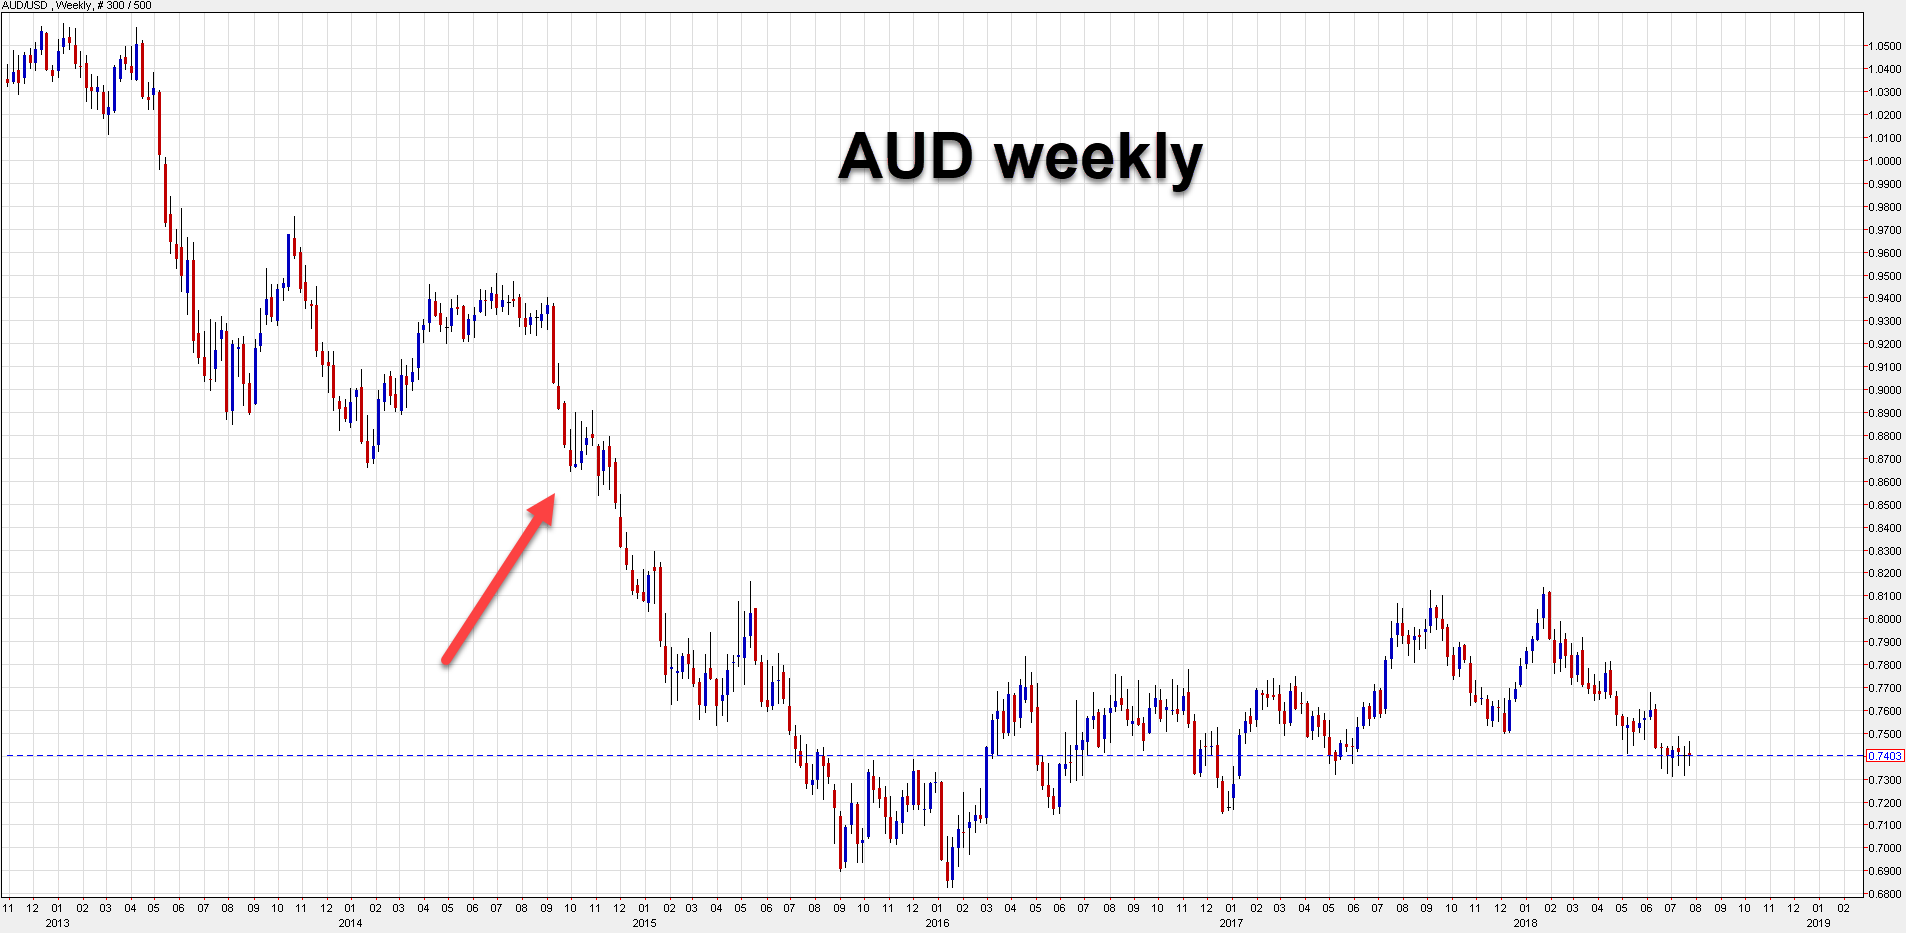
Update: That support level indeed held for a period but two months later the selling began again.