
The NZDUSD took it on the chin yesterday on the back of proof that the Reserve Bank of New Zealand has been intervening in the market (i.e. selling the New Zealand dollar). The sharp and quick fall, took the price down to 0.77102 which is near the low levels from 2013 between 0.7682 and 0.7721.
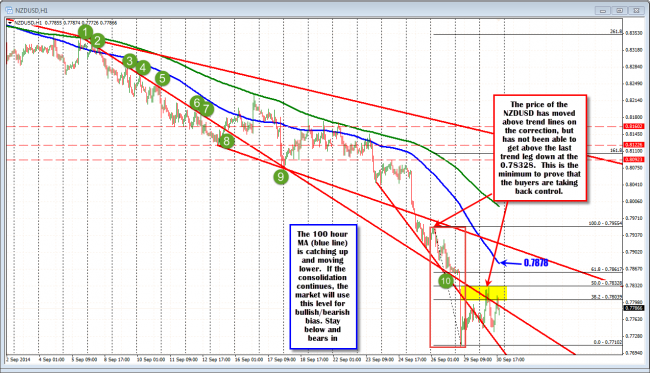
Technical Analysis: NZDUSD consolidates/corrects but the buyers effort is the bare minimum.
The subsequent rally has seen the price move up to the minimal 50% retracement target of the move down from the Friday high to the low reached yesterday. This was the last leg of the trend move lower, but it is in no way representative of the overall trend lower. The inability to get above the 50% retracement of this small leg is indicative of the market that is still struggling with the buy side. The sellers remain in firm control.
The consolidation over the last few days, has allowed the 100 hour moving average (blue line in the chart above) to start to catch up with the price. If the consolidation continues there may be a decision to make by the market – move above the 100 hour MA and correct further, or start a new trend leg to the downside (my favored scenario).
Overall, the buyers have been able to break above a few trendlines in the up and down consolidation/correction, but they have not been able to take back control from the sellers. Until that time that the price can get above the minimum 50% retracement at the 0.78328 level, and then the 100 hour moving average (blue line in the chart – currently at 0.7878, and moving lower), the sellers will remain in control and the trend will remain to the downside for this pair.
Failure to extend and a move lower will have the pair looking toward the 0.7682 low from 2013 and then the 2012 low at the 0.7455 level as the next major target (there will be others along the way that I will follow however). The 38.2% retracement of the move up from 2009 low comes in at 0.7329, and this too is not out of the question if the bears remain in control (again though, it will likely not be a straight line so stay tuned).
FOR OTHER THOUGHT AND COMMENTS FROM EARLIER THIS WEEK SEE VIDEO BY CLICKING HERE
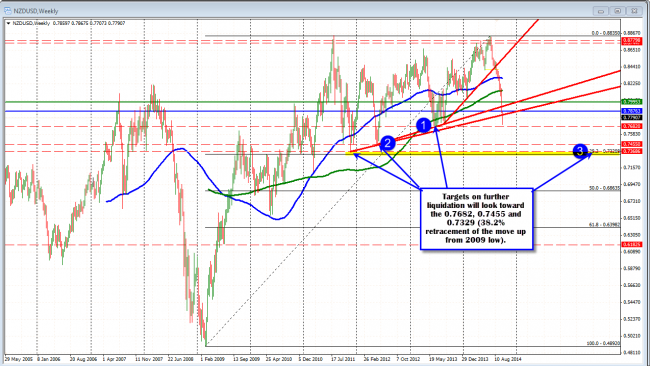
Technical Analysis: NZDUSD weekly chart shows that there is room to roam after the break of trend lines.

