
The USDCAD has pushed lower in trading today after testing the highs from yesterday and the high going back to January 2014. There have been two prominent highs for the trading year. The 1st occurred at the end of January. The second was in March when the January high was taken out but tow days later, was back below the January peak. Today (and yesterday) the first peak was tested and held. Failure to get above, has helped lead to liquidation in trading today.
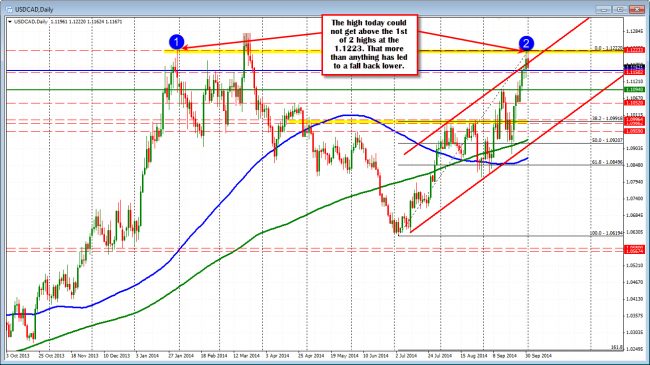
Technical Analysis: USDCAD moves lower after testing 1.1223 high from January 2014
Looking at the hourly chart, there was also selling signals. On the chart below, the high from yesterday was taken out by a few pips in the Asian session today, and then tested again in the London morning session. The failure on 3 separate occasions, has helped contribute to the liquidation in trading here today from that perspective as well.
The move lower has push the price to the 1st major support target area defined by the trend line connecting lows over the last 5 days of trading (see hourly chart below). That level comes in at the 1.1168 level currently. The 100 hour moving average (blue line in the chart below) is not far behind that support at the 1.1157 level.
This area should find support buyers. However, if the MA can be broken, there could be some stops triggered. The pair has been trending nicely to the upside, but momentum is starting to slow. The failure on the daily chart, and the triple top off the hourly chart, may be enough to tilt the bias toward further correction. If traders are short, I would play for the break at least over the next hour or so of trading.
On a break, there is support at 1.1134 and then at 1.1094 area where the low from Friday, the 38.2% retracement, and the 200 hour MA are all currently found. This may be the grander correction target if the price can get below the 100 hour moving average.
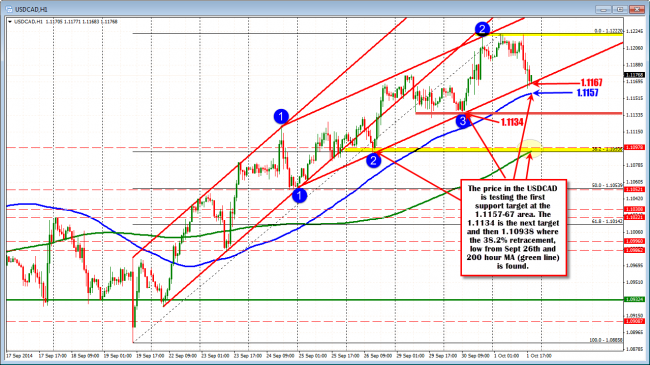
The USDCAD is testing support on the hourly chart against trend line and 100 hour MA.

