
In the morning commentary on the USDJPY, I spoke of the move outside of the box (“USDJPY Technical Analysis: Moving outside the box“). I challenged the market to stay outside the box (i.e. below the 108.485) and indeed it did. CHECK
The next target in the script was to the 108.00. CHECK.
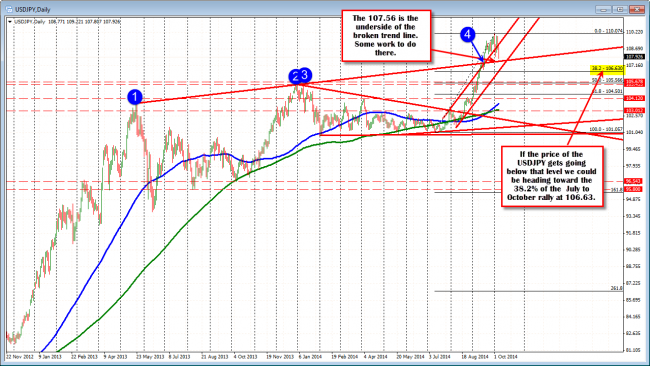
After that comes the 107.56 which is the underside of the broken trend line on the daily chart. NO CHECK (yet?).
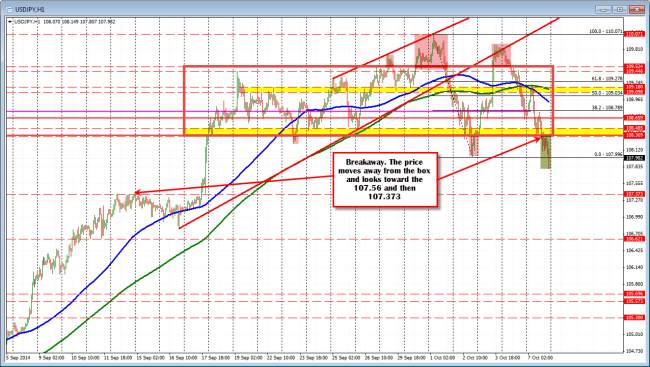
USDJPY breaks away from the Red Box
We have not gotten there yet but we are getting there (see chart below)
The USDJPY has had a run to the upside since July which took the pair from 101.05 to 110.074. The 38.2% of that move comes in at 106.63. If the next target can be broken and the 107.37 (see hourly chart above), that would be were the pair can be going.
USDJPY looks toward the 107.56 now
RISK NOW?
Looking at the 5 minute chart, the 100 bar MA is at the 108.26. The 38.2-50% of the last leg down comes in at the 108.17-285. Of course, if you want to stretch it (and are short from above) , you can continue to use the 108.48 level (the yellow area at the low of the Red Box) as the risk level. THE PRICE should not go above this level since we have now broken out.
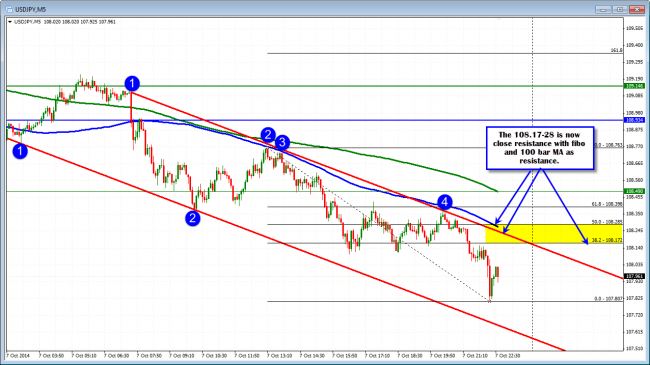
USDJPY risk now. Watch the 100 bar MA on the 5 minute chart.

