
The GBPUSD has broken above the key 1.6000-13 area on the weekly chart. The 1.6000 is the 50% of the move up from the 2013 low. The 1.6013 is the 200 week MA
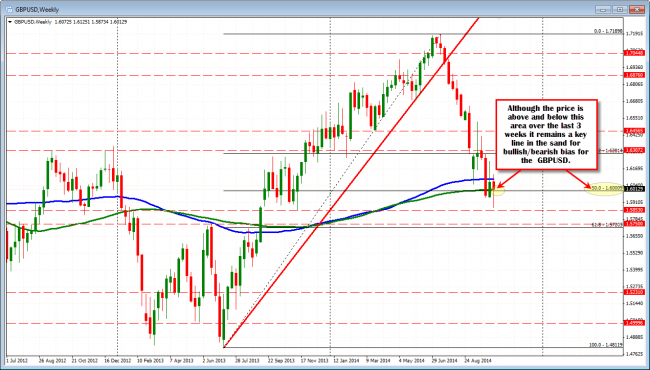
The 1.6000-13 area in the GBPUSD remains a key technical level for the pair.
On the hourly chart the 1.6003 is the 100 hour MA (blue line in the chart below). The 1.60078 is the 38.2% of the move down from last week. Clearly, there is a cluster of levels in the area (see lower yellow area in the chart below). The move above is showing buying interest. Key area to stay above now if the bias is to remain to the upside on the break.
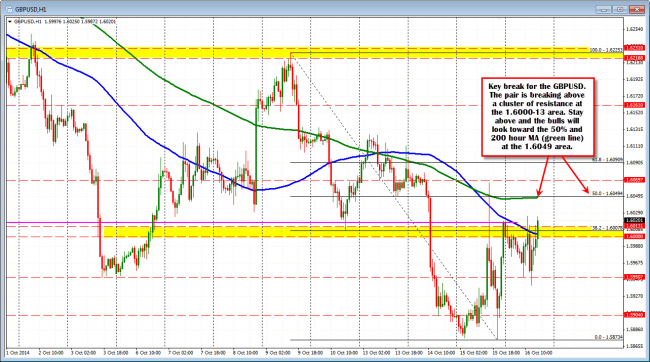
GBPUSD is breaking above a cluster of resistance at the 1.6000 to 1.6013 area.
Risk can be defined against the level now for the buyers. The next key target comes against the 200 hour MA and 50% retracement above at the 1.6049 area.
The pair is being influenced by selling the EURGBP in trading today (moving lower). As this pair moves higher the EURUSD is showing more weakness. Looking at the daily chart for that pair, the price is testing the 100 day MA (blue line in the chart below). This could have an impact on the GBPUSD’s bullishness. If the price can break back below this key MA (yesterday was the first break and close above going back to March), it could lead to more upside momentum for the GBPUSD as well.
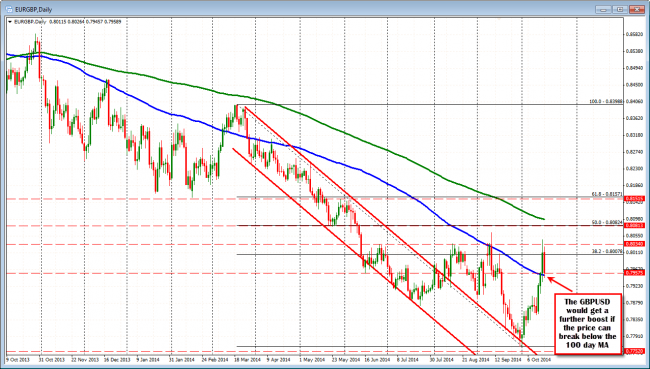
EURGBP tests 100 day MA

