
The USDJPY is up on the day but the gain is modest. With Housing data coming out near expectations, and Yellen keeping comments to topic and not policy or the economy, the action is confined.
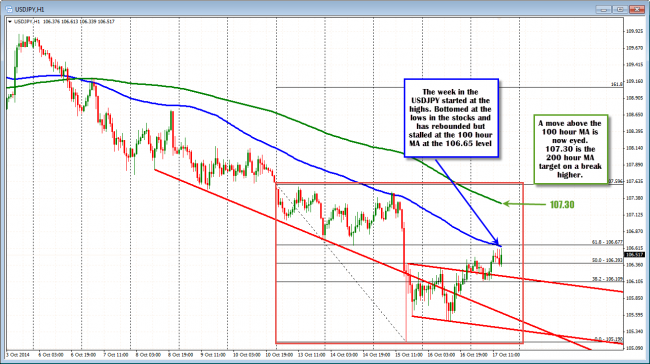
USDJPY finding a ceiling at the 100 hour MA at 106.65.
To date, the pair had the high for the week on Monday in the first hour of trading at 107.596. The price never moved above the closing level from last Friday (at 107.63 area). The low for the week was reached on Wednesday at the height of the stock market fears. The price has since rebounded and moved to test the 100 hour MA (blue line in the chart above) and 61.8% retracement at the 106.65 and 106.677 area. The midpoint of the week comes in at the 106.393.
Do we move above the 100 hour MA and move toward the 200 hour MA at the 107.304? It might be a stretch to get up there but if the stocks rebound strongly, you never know. Of course if the stocks fall, we could see the opposite happen.
The good news is there are some technical levels I see that should give bullish or bearish clues that traders can lean against. As outlined, the upside needs a break (and stay above) the 100 hour MA at the 106.65 level.
Looking at the 5 minute chart, the intraday risk on the downside can be defined by the 100 and 200 bar MAs (at 106.34 and 106.39 respectively) AND the close from yesterday at the 106.31. The price of the pair just found support buyers against these levels, keeping the buyers in charge on an intraday basis and increasing the supports importance from a technical perspective. Stay above the 106.31 = bulls in control. Move below and the story changes as the weekend approaches.
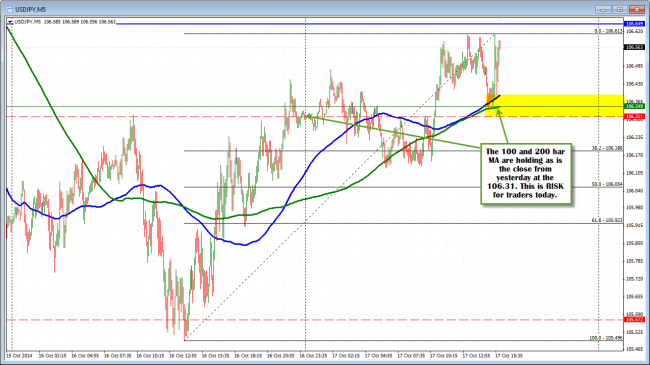
USDJPY holding above the 100 and 200 bar MA and close from yesterday.

