
EUr/GBP held up at resistance along the old Feb 2013 channel bottom and we’ve been catapulted back down over 100 pips.
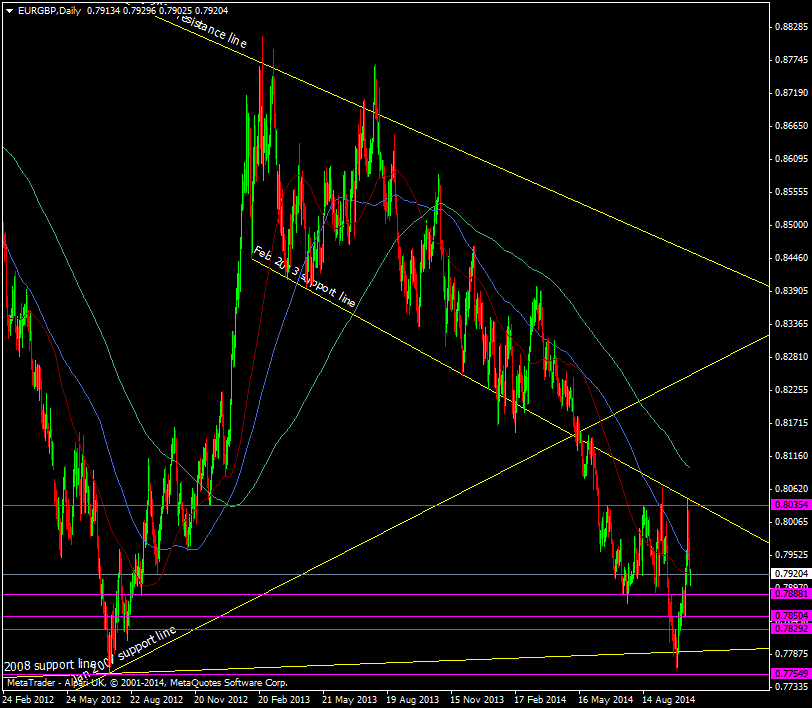
EUR/GBP Daily chart 20 10 2014
We’ve got a strong double bottom down at 0.7755/60 and the trend continues to point down. If the pound pulls out of it’s slump, like it’s looking to do at the moment, then that level will be tested again.
So we’re sitting almost bang in the middle of two pretty strong levels with a decision to make. As always it will be the price that makes the decision for us. Break through 0.7750 and the Oct 2008 low at 0.7694 (call it 0.7700) and we have the potential for a lot of downside. Break up above the Feb 2013 line and 0.8066 hig and the upside beckons. I’m personally in rally selling mode still as I see no reason to long the euro as soon as the rate talk picks up again we’ll be going south in a hurry.

