
Morgan Stanley was reported to be selling the EURJPY at the 137.00 level in trading today (see the post from ForexLive’s Ryan Littlestone: Morgan Stanley load up on EUR/JPY shorts at 137.00). So far so good, as the price high was at the 137.00 level (I assume they got short in that area) and the price for the EURJPY has indeed moved lower – bottoming at the 136.265. Three cheers for Morgan Stanley.
Last week, I wrote that the EURJPY was tied to the stock market (see: EURJPY Technical Analysis: I want to move like stocks. Indeed, the moves in the EURJPY has been moving like stocks do. Today is really not much different
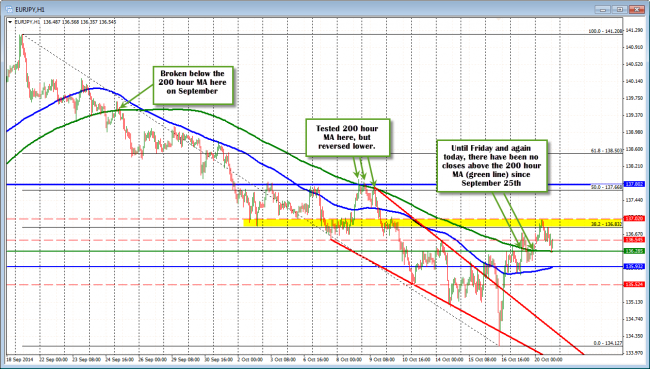
Until Friday and again today, the price of the EURJPY has not traded above the 200 hour MA. Is the correction over?
As a result, in today’s trading, we have seen the price rally in the Japan session when equities were roaring higher. In London the price started to retreat as the stocks started to come back down. Currently, we are moving a little higher as the market digests IBM’s miss, and the indices like the S&P and Nasdaq show small gains.
Looking solely at the EURJPY chart, the price low for the pair did find support against a key technical level. today. The 200 hour MA (green line in the chart above) comes in at 136.28 and the low reached 136.265. The price has bounced higher to 136.54 area.
The pair may want to “move like stocks do” and it may have a name behind the selling with Morgan Stanley’s short recommendation. However, for me (and perhaps many others), the question will be, “Can the 200 hour MA be broken?” . Up until Friday (see hourly chart above), the price for the EURJPY has not been able to close above the 200 hour MA since breaking below on September 25th. The move higher on Friday (which failed), and again today, is something new from the bullish side. Therefore, to confirm the corrective high is in place and the downside is the continued way to go for this pair, look for a break below the 200 hour MA to help confirm the reversal of the move higher. If it can’t do that, the top may not yet be in place.
PS: Looking at the 5 minute chart below, the EURJPY rotated up to the 200 bar MA (green line in the chart below) on the last correction and held. The 100 and 200 bar MAs (blue and green lines) will be eyed as resistance (RISK level) for the shorts intraday. Stay below and the intraday bears – started by the Morgan Stanley short recommendation – remain in control. Move above and there may be more short covering. Look for sellers against the area on the test (don’t want to go above 136.719). If it holds, we may see by the end of the day, if that 200 hour MA can indeed be broken.
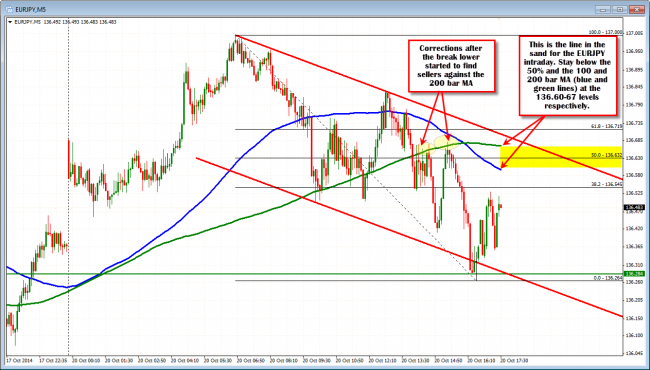
EURJPY. Watching the 136.60-67 as intraday resistance now.

