
Forex Technical Analysis: GBPUSD chops falls below trend line but support looms below
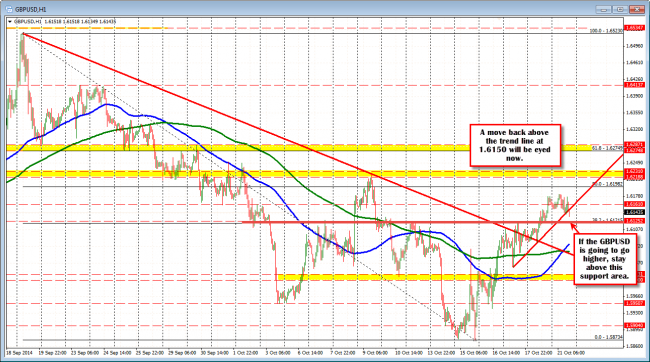
The GBPUSD has dipped on the better Existing Home sales and fell below a trend line on the hourly chart at 1.6150 currently. Is this a sell? I am not so sure for this pair.
The pair has been chopping up and down – but keeping most of the upside move. The price yesterday moved above the 38.2% of the move down from the September 18th high. That level comes in at the 1.61215 level. This has been a recent ceiling for the pair (see red line in the chart below). It did move above this ceiling on October 8 and 9, and failed. The move above yesterday is the second shot to move away from the lower trading area where most of the trading has taken place this month.
GBPUSD correct/consolidates but support at 1.6121 area should hold (risk for longs)
The price may dip down toward this level, but I would look for buyers against it on a dip. If the level holds, a move higher toward the 1.61982 level will be eyed as the next key target. This is the 50% of the move down from the same September 18th high.
If it price goes below the key red line, I won’t be as excited about the GBPUSD prospects as it would be the 2nd failed attempt above the ceiling.
At the moment though, I would prefer to wait out the correction and look to buy against the 1.6121 area.

