
Gold has moved to new lows for the day and trades at the lowest level since October 10th. The 50% of the corrective move higher in October comes in at 1219.03. This is the next target on the downside off the daily chart.
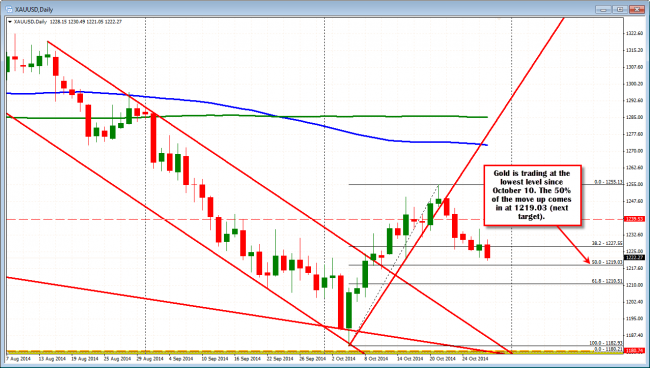
Gold trades ast
Looking at the hourly chart below, the price moved briefly above the 100 hour MA (blue line) in trading yesterday off of the US data, but quickly reversed. Today, the price sniffed the 100 hour MA but failed to extend above the key technical level. Momentum in the last hour has been helped by a move below the 38.2% retracement at the 1227.55 level (a risk level now for the shorts). The 1220.96 is bottom trend line support, followed by the 50% level at 1219.03.
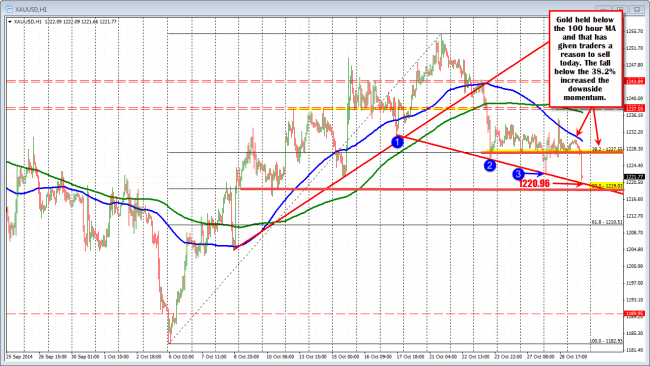
The Gold price held below the 100 hour MA (blue line) and fell below the 38.2% line.. Momentum accelerated. Now risk.
Looking at the 5 minute chart, the price has a trend like move lower where sellers overwhelmed the buyers. If the buyers are to take back control, they need to breach the 38.2-50% of the move lower at the 1223.73-1225.56 area. Look for sellers against this level. If the sellers loved selling it down toward the next support in a trend like fashion, they should love selling it again on a correction toward this area.
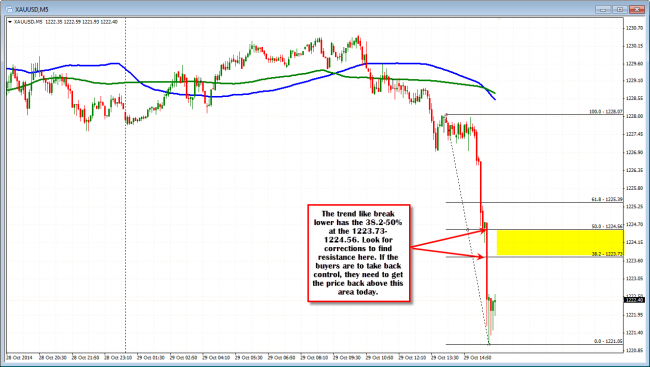
Look for corrections to hold against the 38.2-50% of the trend like move lower now.

