
The AUDUSD has been under pressure in trading today.
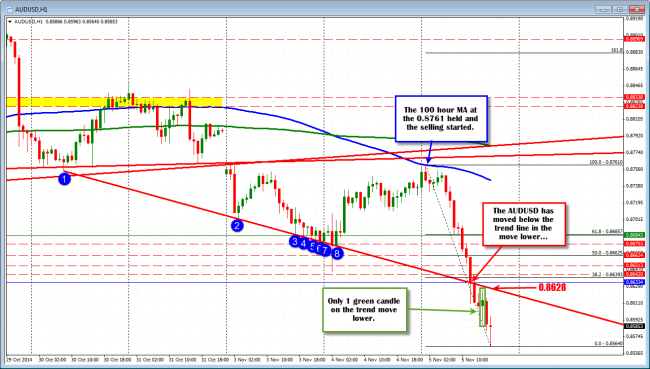
The AUDUSD started at the 100 hour MA, and has trended lower since (only one green candle). Resistance at 0.8628.
The pair has nearly a 200 pip trading range (198 pips). The average over the last 22 trading days (around a month) is 106 pips. The move lower started when the price held against the 100 hour MA (see hourly chart above). The selling has been steady. There has only been one green candle in the meat of the trend move lower. The price is trading at the lowest level since July 7, 2010.
What is the next target?
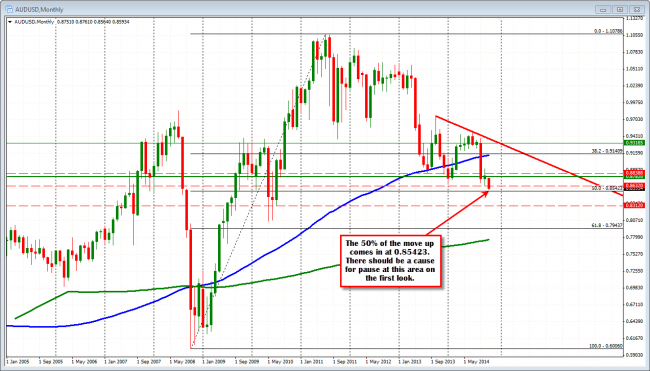
The monthly chart shows the 50% of the move up from the 2008 low.
Looking at the AUDUSD monthly chart, the price is approaching the 50% of the move up from the 2008 low to the 2011 high. That level comes in at the 0.85423 level. The low today is at 0.8564. If the price it to move lower from here today, this should be a KEY support level that gives traders cause for a pause – at least on the first look/test. The low got within 22 pips so far today.
Like the USDJPY post earlier, however, the pair is trending and trends require extra care. The 5 minute chart below, shows the momentum lower in trading today. The pairs last leg lower, has the 0.8592-0.8600 as the close resistance for the pair . A move above this level would take the price above the topside trend line. Does it call the end of the sell off? It is just a sign that the buyers are taking back some control, but there is more proving to do before victory by the buyers can be declared. For one, a move above the 100 hour MA would be needed (blue line in the chart below at the 0.8630 level and moving lower).
The trend is down but the momentum may be slowing. Be aware of the key levels and lean against them for new trades.
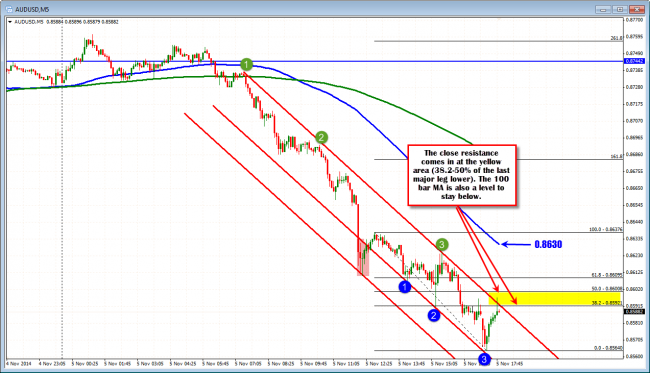
AUDUSD on the 5 minute chart shows first resistance at the 0.8600 area.

