
We had a test of the 0.8660 level last month and we’ve smacked through it this month and to the lowest since July 2010.
The next target is the 61.8 fib of the 2008/2011 swing at 0.8536. By hook or by crook the RBA may yet hit their 0.8500 price target.
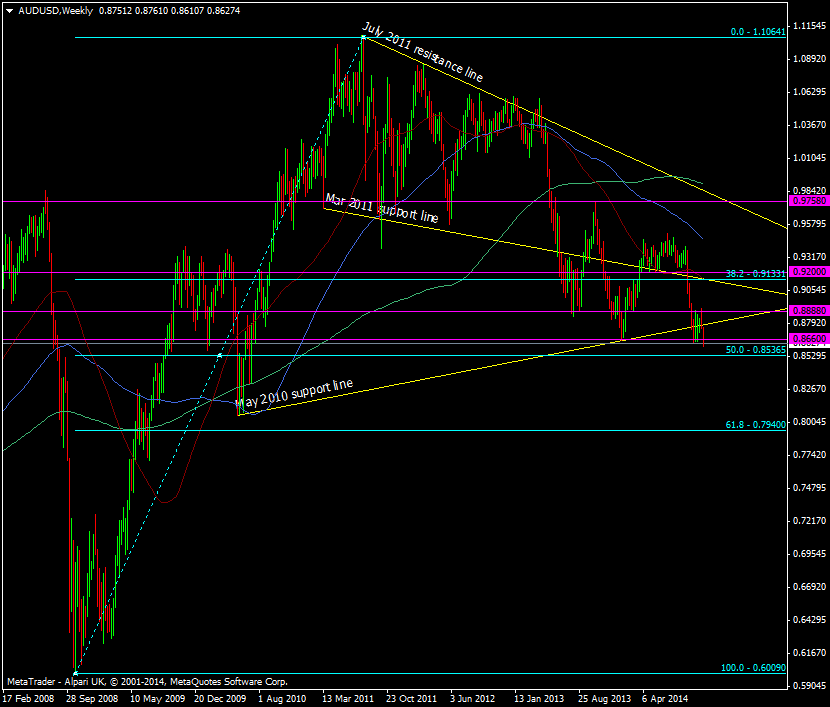
AUD/USD Weekly chart 05 11 2014
Zooming in a bit to the hourly, look for mild resistance resistance to come in at 0.8640/45 then 0.8660, 0.8700 and stronger at 0.8760, though that seems a long way away right now.
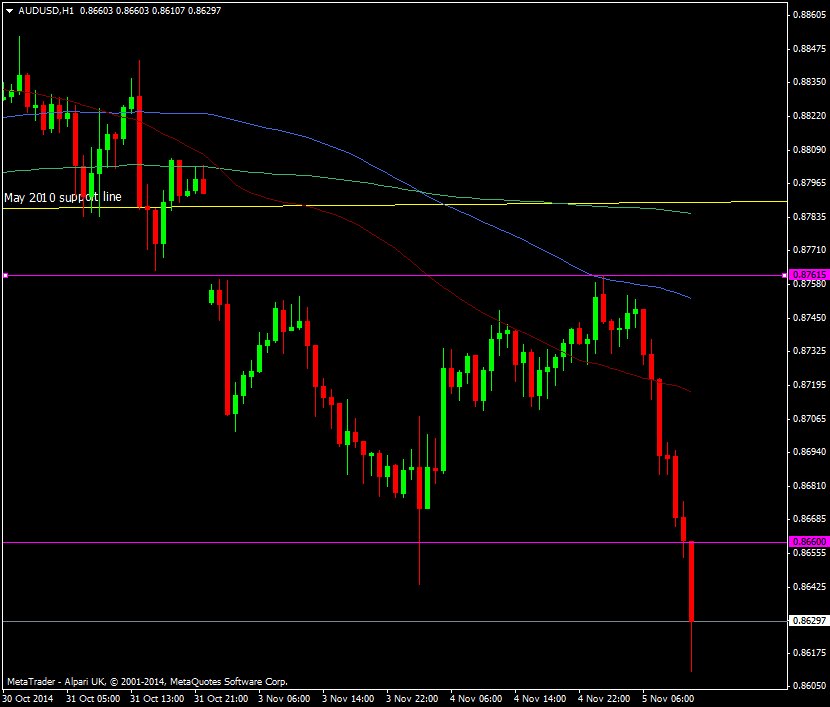
AUD/USD H1 chart 05 11 2014

