
The 50 fib of the 2008/2011 swing up at 0.8544 held up on Friday and we’ve tacked on over 120 pips since then.
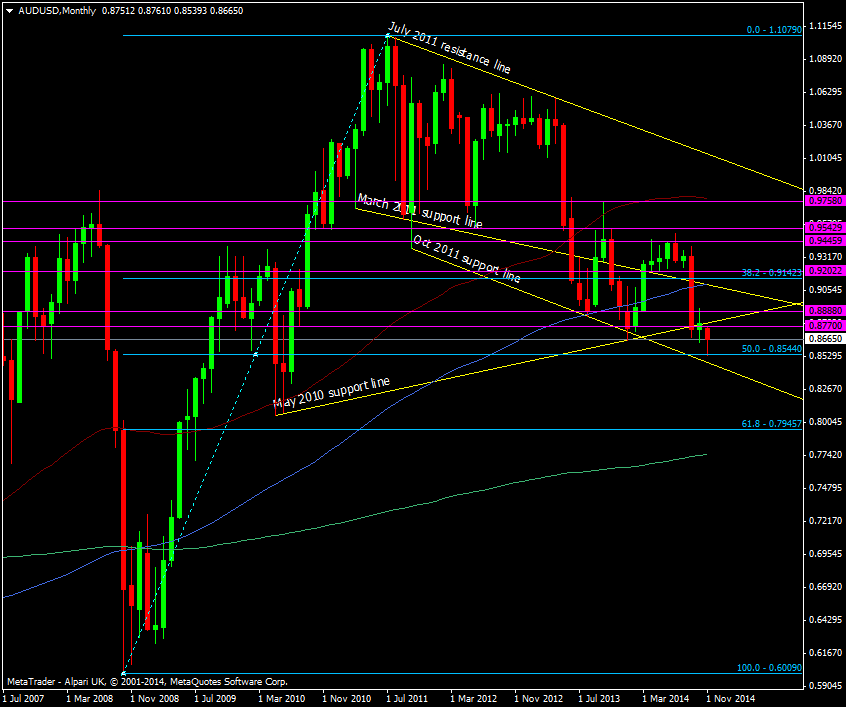
AUD/USD Monthly chart 10 11 2014
The 0.8670/75 level is proving to be just as tough as resistance, as it was as support on the way down and we need to get above it before thinking about taking on 0.8700 and the stronger 0.8770 level above that.
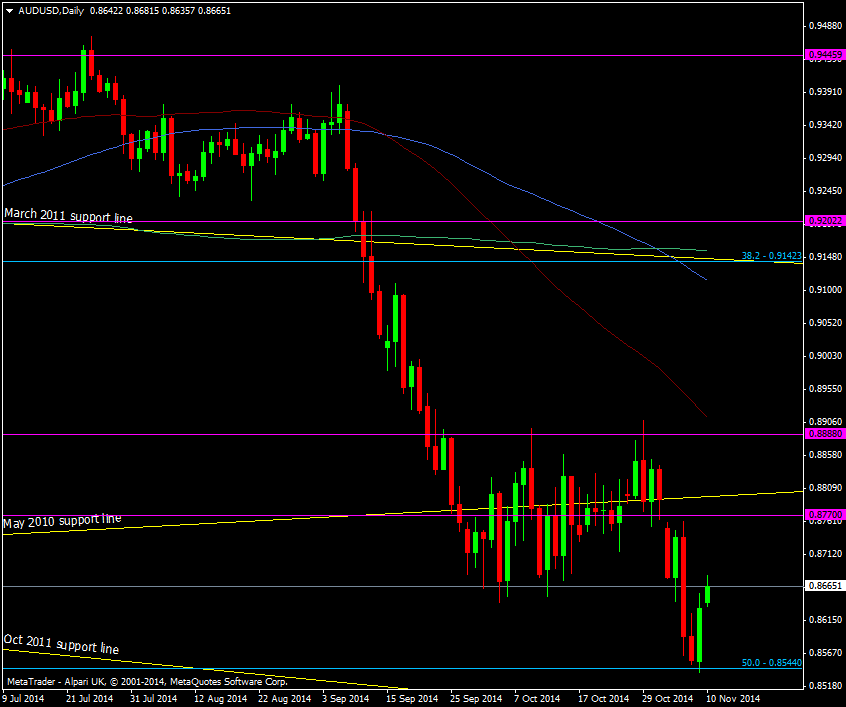
AUD/USD Daily chart 10 11 2014
The reaction in USD has been telling as the jobs reports becomes an inflation trade and Kuroda signals that the quick pump two weeks ago was probably just a one off. On that basis perhaps we have a case to see further gains in the aussie.
It’s not a trade I would chase as all it will take is a round of decent data from the US to get the bulls loading up again and trying to push higher, which will hit AUD/USD again.
There will come a time when AUD/USD will be a good buy for the long term but I don’t think that is now. Once the market has its US rate hike then things will settle down in the dollar and currencies like AUD and NZD will be worth looking at. Until then, it’s a two way market and there’s plenty of levels to make a pip or two from.

