
Not exactly a textbook chart in gold
The gold chart is a frustrating one in some ways but makes perfect sense in others.
On Friday I was focused on the potential for a three-candle reversal in gold. That’s normally a powerful signal especially after the washout to $1131 in Asian trading.
It was confirmed by the close above the highs of $1175 late last week.
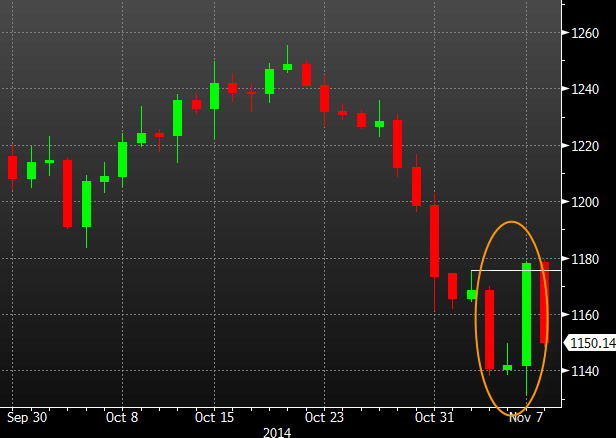
Three candle reversal
But today gold has given up almost all the gains and is down $27 to $1151.
The lines to have been focused on, in hindsight, were the 38.2% retracement of the swoon and the early Oct low. Those held and were the signal to sell.
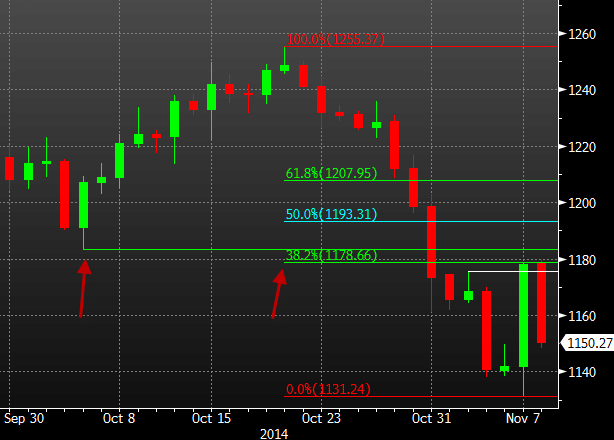
Gold technical analysis
You can’t get every trade right (I took profits on a short on Friday and regret it) but you can always learn something and hope to get it right next time.

