
The GBPUSD has continued the move lower and is down testing the 61.8% of the move up from the 2013 low to the 2014 high at the 1.57203 level. The low has reached 1.5724 and the expected buyers against the technical level are showing up. On a break, those buyers should look to sell. On rallies, they may also look to sell as the trend is still to the downside for the pair following the more dovish Inflation Report released yesterday.
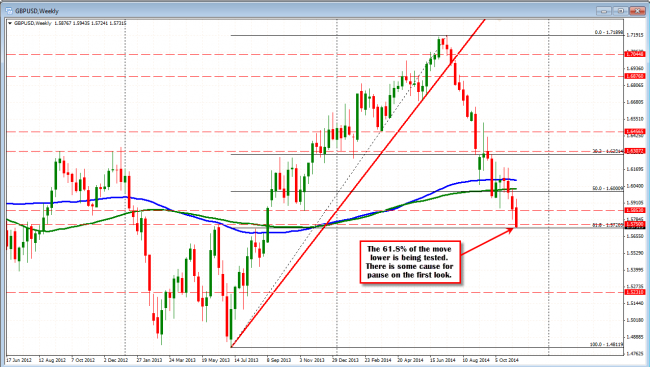
The 61.8 % of the move up from 2013 low comes in at 1.57203
Looking at the 5 minute chart, the pair is in a wide trend channel. The pair is consolidating against the 1.5720 area. The topside trend line and the 38.2-50% are levels to lean against for sellers if there is to be a break of the 1.5720 down the road (and if support does hold at the 1.5720 level). A move above the 1.5750 would not be welcomed, however.
I know the BOE Inflation Report was dovish and pushes the tightening potential out. The move lower this week is also pushing away from the 1.6000 level. That should now be a ceiling for any corrections. As we go lower, however, the selling becomes harder as the levels become more balanced – 1.5720 is not 1.6000. Can we go lower still? Yes.The 1.5400-1.5500 area is an area to target. Also 1.5260 area sticks out as a level as it was lows in 2011 and 2012. To get there, however, the Fed will have to stay committed to the 2015 tightening idea. That may fade if the global situation worsens (NY Dudley said today investors should be patient with regard to Fed tightening) .
PS GBPUSD is currently testing 1.5720 as new lows are being made at 1.5722.
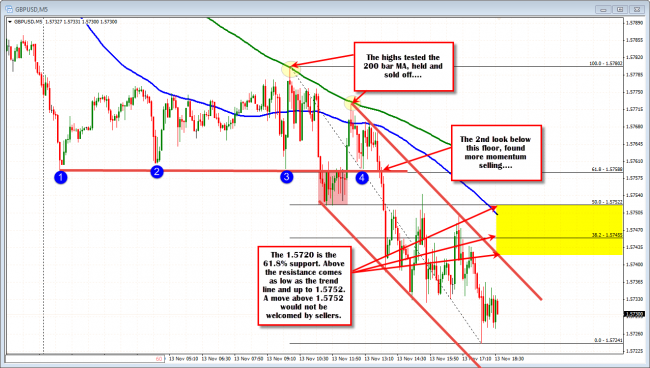
GBPUSD on the 5 minute chart has resistance against trend line and retracement levels.

