
The USDJPY is consolidating in a narrow trading range today The pair dipped on the weaker than expected Initial Jobless Claims but the move was modest. It did though extend the range for the day which sits at a narrow 58 pips vs the 22 day average of 114 pips. Their is room to roam for the pair (i.e. a range extension higher or lower). Be aware.
There is also some look ahead for the pair with the Japan GDP coming up on Sunday/Monday. The estimate is for a modest 0.5% bounce back from the sales tax influenced 2Q which came in at -1.8%. Private consumption which plunged -5.1% is expected to rebound by an also modest 0.8%. In a post from Ryan earlier today, he outlines that the combination of the GDP, rumored Sales Tax delay and snap election are not priced in and that the pair has the potential to move to 120.00 area. See: USD/JPY to 120 on positive Japanese GDP numbers says Mizuho
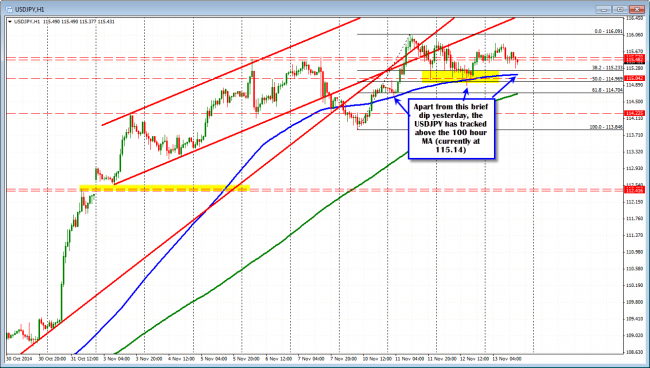
The market has been using the 100 hour MA as a support level
What are the levels from a technical perspective that will keep the bullish bias in tact?
Looking at the hourly chart below, the pair has been tracking the 100 hour MA (blue line in the chart above). That level currently comes in at the 115.14 level. Yesterday, the price dipped below the line for maybe 5 minutes before rebounding. The sellers simply did not have the will to take it lower and wrestle control from the buyers. On Monday, shortly after the opening, the price moved below and spent most of the day below the MA line (low was printed 113.846), but in the NY session the price moved back above and stayed above. On Tuesday, the market used the level to lean against (the low was just above the MA line) and the price reached it’s high for the week at 116.09 (follow the blue line 100 hour MA line in the chart above).
If the price is going to extend higher, staying above the 100 hour MA will be important from a technical perspective today and going forward.
What does the intraday chart look like?
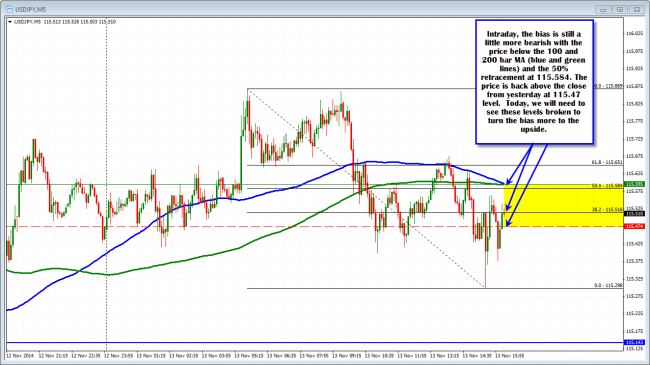
The 5 minutec chart is more bearish below the 115.595 area (100 and 200 bar MA lines).
The intraday 5 minute chart is a little more bearish with the price below the 100 and 200 bar MA (blue and green lines) and the 50% of the trading days range. The price has been moving above and below the close from yesterday at the 115.47 which is also not so bullish (not so bearish either, but).
If the price is to base and move higher today (taking out the highs and extending the range), a move above the 115.595 (where the 100 and 200 bar MA are at) should give traders the technical clue that the downside probe is complete. There should be a shifting of the trade momentum.
If it cannot, the bears remain in control, and a closer test of the 100 hour MA (at 115.14) might be the way today.
When the range is so narrow, little clues help. If you like the upside, you want to see the close from yesterday eventually hold support. You will then want to see the price move above the 50% and the 100 and 200 bar MA – and stay above. Often times “the market” will give some little clues that give more trading confidence in the trade.
For the sellers, you want to see the opposite. You will not want to see the price move above the 100 and 200 bar MA off the intraday chart, but find the sellers against the level.
Eventually, one will take control and there will be the next momentum move.

