
The dismal 3Q GDP numbers (-0.4% QoQ/-1.6% YoY put Japan into a recession), sent the Nikkei falling -2.96%. When stocks fall, the Pavlovian reaction is for the JPY pairs to follow to the downside. Of course, there is the “other story” that weaker GDP might bring about even more stimulus (or certainly less fiscal contraction in the form of the sales tax increase). and the comments from Japanese officials to these points, sent the USDJPY back higher (I think this is the right way).
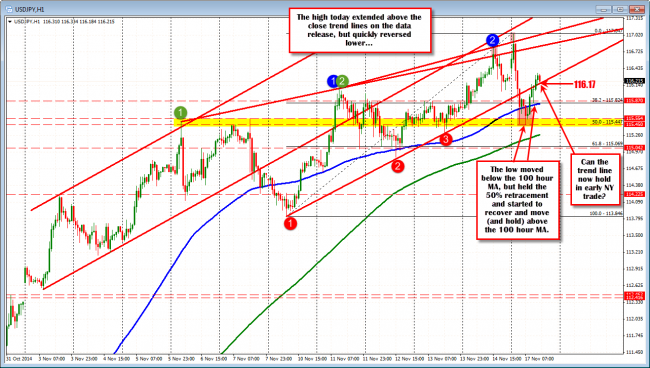
From a technical perspective, the price of the pair initially saw the price of the USJPY rise, then fall as stocks unraveled. The high for the day extended above recent topside trend lines but found sellers just above the 117.00 level (high extended up to 117.04). The subsequent fall, sent the price below the lower trend line, and the 100 hour moving average (blue line in the chart above). The decline stalled at the 50% retracement of the move up from last week’s low to the high (at 115.444).
The price of the pair is currently above the original lower trend line (see chart above). That line comes in at 116.17 and represents close support as NY traders enter for the day.
Looking at the 5 minute chart below, the close from Friday is around 116.25. The 50% retracement of the days trading range is 116.244. The current price at 116.24 is right at those levels. The price is above the 100 and 200 bar moving averages (blue and green lines in the chart below) that come in at 115.986 and 116.087 respectively. So the pair is perhaps a little more bullish now. Stay above those MA levels and I will give the buyers the control. Move below (see yellow area in the chart below) and that bias shifts more to the downside.
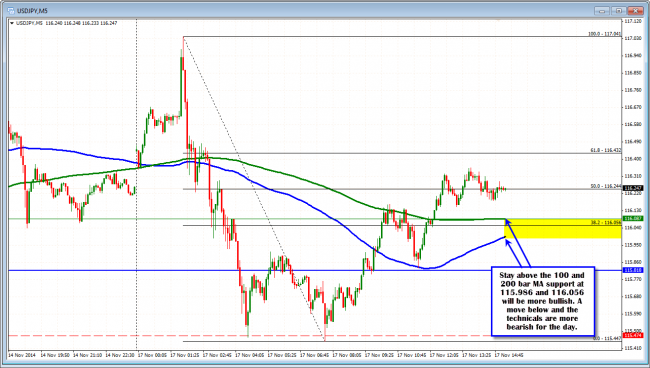
The rebound has the price at the 50% of the days range and near the close from Friday as well.
It would seem to me that this is the best place to be but fundamental data out of NY might be the swing vote for the pair in trading today. Empire Manufacturing comes out at 8:30 AM ET (est 12.00 vs 6.17 last month). Later at 9:15 AM ET, Industrial Production and Capacity Utilization will be released (Est +0.2% and 79.3% vs +1.0% and 79.3% last month). As is or better data should keep the narrow edge to the buyers and there should be another move higher- away from the 50% and closing neutral area.

