
A real world example and the technical analysis lessons
Yesterday, I opened my commentary with a post on the EURUSD titled “Forex Technical Trading: EURUSD down but in a broader land of confusion” . Today, we remain in the “land of confusion”, but with a more bullish bias so far.
The EURUSD is more bullish but still confined by the trading range
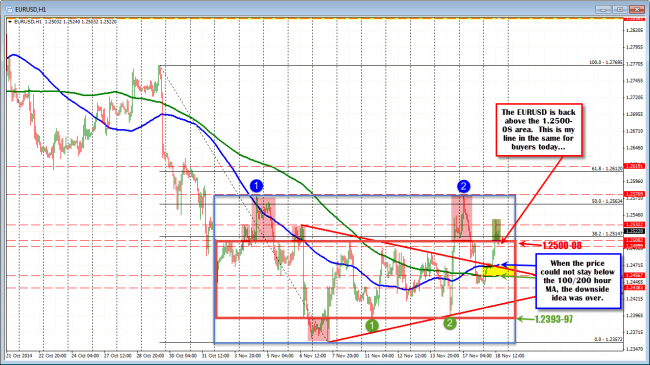
The pair yesterday fell below the 100 and 200 hour MA (blue and green lines in the chart above). That was more bearish, but the momentum below those levels could just not get going.
When the price moved back above these MA in trading today, the downside idea was all over. Better German ZEW data helped the pair and it ultimately moved above the 1.2500-08 area.
The 1.24995 level was the low on October 3rd (ending the September slide). The 1.2508 was the high price from last week, until the Friday break. Most of the trading activity over the last 12 trading days has been between the 1.2394 to 1.2508 area (Red Box. There have been attempts to extend above. Yesterday, the price in the Asian and early London session gave the old college try to the upside, only to run into the high from November 4 at the 1.25769 level (double top – blue circles) and perhaps fears from what Draghi would say. His comments did send the pair to the lows in the early NY session but the selling dried up. The rally back higher began.
We have spent the last 5 or so hours above the 1.2500 level and the higher than expected PPI data just released did not stop the pair from dipping below the support level. So the buyers remain in control.
However, remember that we still are in the land of confusion for the EURUSD. So stay above 1.2500-08 and all is ok for the buyers. Move below and the buyers will likely change allegiance. On the topside, move toward the 50% at 1.25634 or the 1.25769 double top, and the traders should come back in and sell. One day, the market will break outside the boxes but until then, take what you can get, play ranges (until the break out) and be happy.
FOREX EDUCATION: When the market trades in a sideways, up and down pattern, it says to me that the market does not know what it wants to do with the currency pair. Why else would it chop around? Putting it another way, buyers and sellers are balanced in these defined areas.
Technically, when the price chops around, moving averages don’t work all that well (see blue and green lines and how they start to go sideways and the how the market is ignoring them). However, “remembered levels (i.e., ceilings and floors) start to develop and become more important as levels to ping pond between. One can argue that the November 10th high created a ceiling and the November 11th low created a floor (for the Red Box that is). If traders can define these areas early on, a non- trending mindset can begin, and traders can start to lean against the peaks and valleys to their advantage. It is not easy. There may be false breaks or fears from making the transition. However, risk can be defined and limited too. The goal is to not fall too in love with being bullish or bearish.
Over time, that mindset should change and start to anticipate a break out of the “Land of Confusion” (i.e., the consolidation area(s)). The market simply does not stay in the same spot for too long. There will come a time when the buyers or sellers take on the alpha-dog role and the market trends again. When might that be? One never knows, but I typically will look for a clue from a trend line and maybe even a 100 or 200 hour MA that was ignored but now becomes a level of importance. You have to keep your eyes open for those little subtle clues and then look for the break ahead.

