
The EURUSD made yet another year low. The low to high trading range is low at 58 pips. The average over the last 22 trading days is 106 pips. So there is room to roam further (i.e., outside the current range). That can be higher or lower by the way.
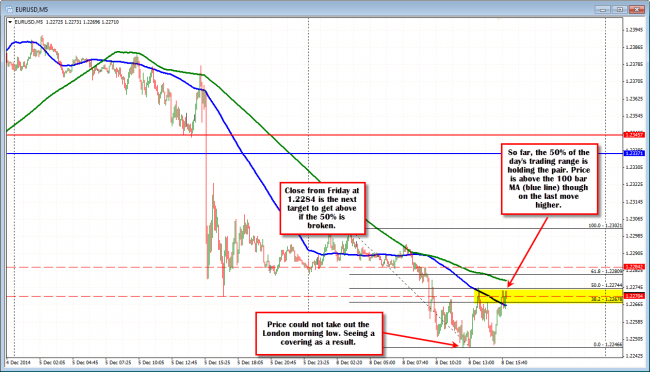
EURUSD is up testing the 50%. of the days trading range.
The early NY trade, pushed the price near the London session lows without taking it out. The correction off that low, has taken the price back toward the 50% of the days trading range. Sometimes, in a narrow trading range day, that level becomes the swing level. Stay below, and the intraday bias is down – move above, and the sellers turn to buyers. The next target tackle on a move higher would be the close from Friday. I have that around the 1.2284 area.
Of course, we are coming off a robust US employment report from Friday, where the EURUSD fell sharply on the report but consolidated for most of the day (the low came in at 1.22704). We are currently trading near that level.
On Thursday it was a different story for the pair, as the ECB and Mario Draghi were more “hawkish”/”less dovish” than what the market expected after announcing no change in policy. Nevertheless, the fundamentals are still suggesting the dollar should be stronger.
What are the longer term charts saying?
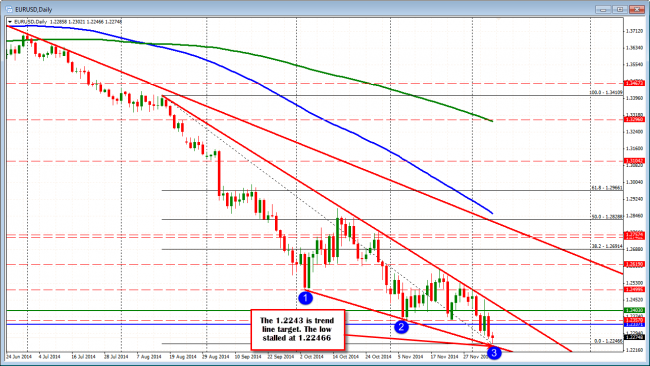
The 1.2243 is the lower trend line on the daily chart.
With the price near 2014 lows, the bias is negative of course. The pair is approaching the next technical support levels. On the daily chart below, the lower trend line comes in at 1.2243.T The low for the day came in at 1.22466. I guess that is a close enough test and hold.
A move below that level this week would next target the 1.2224 level. This is trend line on the weekly chart (connecting the 2010 and 2012 lows). Below that, the 1.2131 is the 50% of the move up from the 2000 low (all time low for the EURUSD post the Jan 1999 introduction). The trend line connecting the 2005 and 2010 lows comes in at 1.2109 (see chart below). If the selling bias can continue, these levels would be potentially in play this week.
Back to the present though. A move higher (above the aforementioned areas) will look toward extending the narrow range to the upside. The high comes in at 1.2302. The 38.2% of the move down from Friday is at 1.2326. The 100 hour MA (not shown) is currently at 1.2337 (and coming lower).
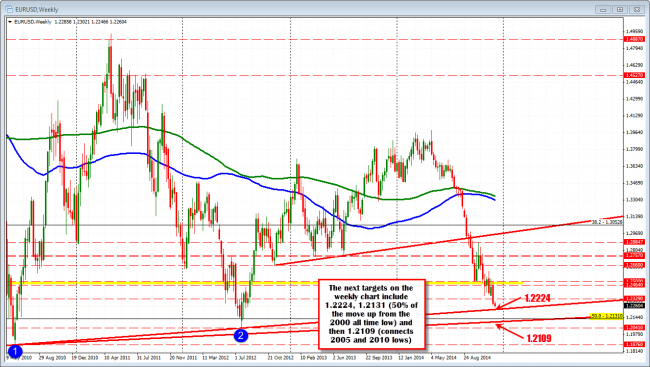
The weekly EURUSD shows the next major targets

