
In an earlier post on the GBPUSD, I noted the bullish overtures from the action on the hourly chart (see: Forex Technical Trading: The good news for GBP)
GBPUSD stays between the intraday support and resistance levels
My apprehensive but bullish appetite was described in the following way:
Can the buyers off the lows today, keep the momentum going? Watch for close support at the 50% midpoint area at 1.56824 for the early trading day clue (the midpoint of the day comes in at 1.5676 so perhaps down to there for the buyers risk).
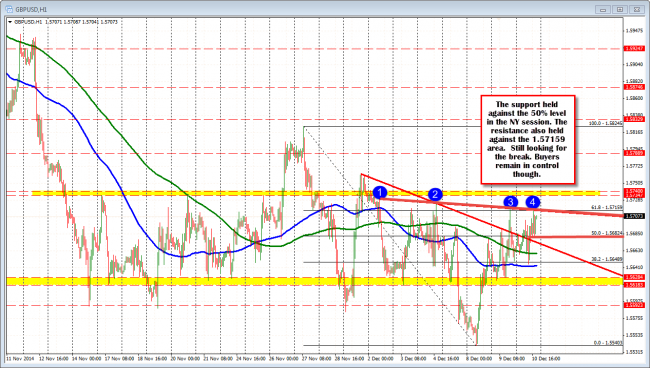
The good news is the support held. The low for the NY session bottomed at 1.5681 – a touch below the 50%level at 1.56824 but still above the 1.5676 midpoint of the days range.
What has that trade gotten me?
In the same post, I outlined the challenge for the day above. I commented:
… there is further work to be done. That work will start with a move above the topside trend line and 61.8% at the 1.57159 area
Well, the high reached 1.5718 – a few pips above the 1.57159 level on the hourly chart. However as noted in the prior post, the 61.8% retracement off the daily chart is at 1.57203. So resistance did in fact hold.
In summary then, support held at 1.5676-82 (low 1.5681) and resistance held at 1.57159-203 (high 1.5718). The buyers remain in control, but the further work I talked about earlier still needs to be done. The good news is the price is heading up for the next test. Will the 3rd test of the line in the last two days, be the one that breaks above? If so, 1.57347-1.5740 waits above with more resistance. A traders work is never really done!

