
The GBPUSD is retracing the earlier steps to the downside. That move lower started on the failure above the 1.5734-40 area (a home to a number of highs since November 14 – see topside yellow area) and stopped on the downside today, at the 100 hour MA. (blue line in the chart below).
The price move higher since that low, has been able to pierce the 1.57159 level which is the 61.8% of the move down from the November 27th low. That level was also near highs from Tuesday and Wednesday.
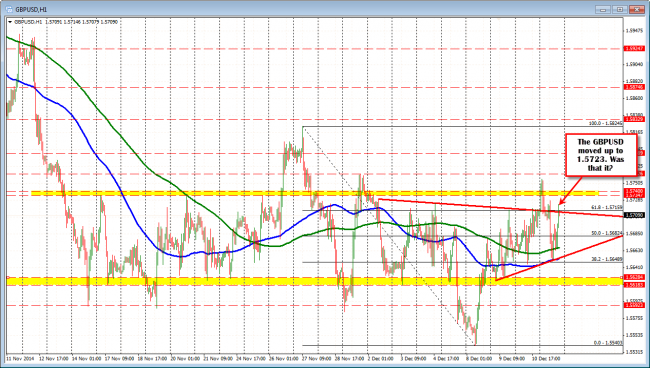
The GBPUSD extended above the 61.8% of the move down from November. at 1.57159 but back below the level.
Now with the price moving up to 1.5723 and trading back lower, I wonder if the up is over, and the down is the new direction? As implied in the last post on this pair, anything is possible. For me, if the short is the new way, I start to question the trade if the price moves much above the 1.5723 level. The 61.8% of the move up from the 2013 low comes in at 1.57203. The high is 1.5723. I assume it should hold. Where might it go from there? You are just looking to retrace, what was just retraced. SO get below the 1.5682 midpoint is step 1. It remains a trading market.
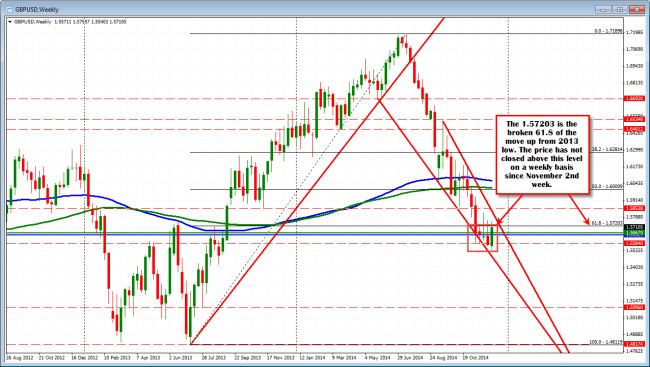
The GBPUSD has not closed a week above the 1.5720 (61.8% retracement) since November 20 week.

