
Cracks in the S&P technical picture, lead to a bigger leak
Earlier in the week (on Wednesday), I warned of technical cracks in the S&P index’s chart. Specifically, I commented on the fall below a broken trend line. See: S&P Technical Analysis: Showing cracks as the price moves back below broken trend line.
Specifically, I wrote:
From a technical perspective, the price fell back below a broken trend line (at 2054.80 today). If the price can stay below this level, the corrective sellers will stay in charge. The 50 and 100 day MA is at the 1998.28 and 1987.51 levels respectively today. If the bears can remain in control, this would be targets on the correction.The 38.2% of the move up from the October 15 low comes in at 1980.60. A move to the 38.2% would represent around a 4.7% decline from the high if reached. Certainly, within the realm of possibilities.
On Thursday, there was the test of the broken trend line (the line was at 2055.42, and the high came in at 2055.53). That line held and the price moved lower.
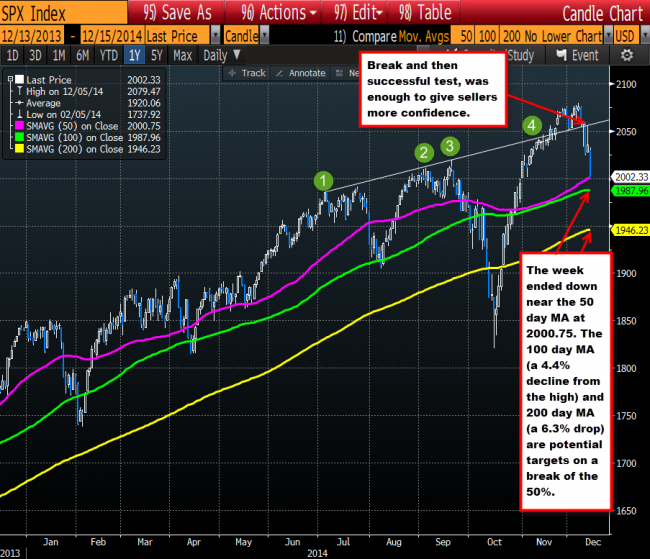
On Friday the crack, led to a bigger leak and the test of the 50 day MA target was quickly approached. The low for the day came in at 2002.33. The 50 day MA is at 2000.75 (see chart below).
It the selling can continue into next week with a move below the 50 day MA at the 2000.75 area, the 100 day MA at 1987.96 currently and the 200 day MA at 1946.23 are the next major targets. Should the price reach these levels, it would represent a 4.4% and 6.3% correction from the peak. In October, the fall from the September high to the October low was about a 9.8% decline.
The S&P’s cracks led to a leak in trading this week.
Look for the 100 day MA to provide some support on the first test. The FOMC decision on Wednesday should keep the market on edge.
The FOMC statement will be a focus. If the Fed keeps the language (i.e. extended period of time), the fears in the market will likely fade away as the market welcomes the status quo and the economy benefits from low rates, low oil, continued Fed stimulus, increasing overseas stimulus, etc..
If, however, they show more hawkishness, a further reaction to the downside should occur.
Close resistance comes in against the low from low from Wednesday (at 2024.26) and the high from Thursday (at 2025.43) . The 50% of the move down from Thursday’s correction higher, comes in at 2028.79. This too will be eyed for momentum clues. Stay below, and the bears remain in control (see chart below).
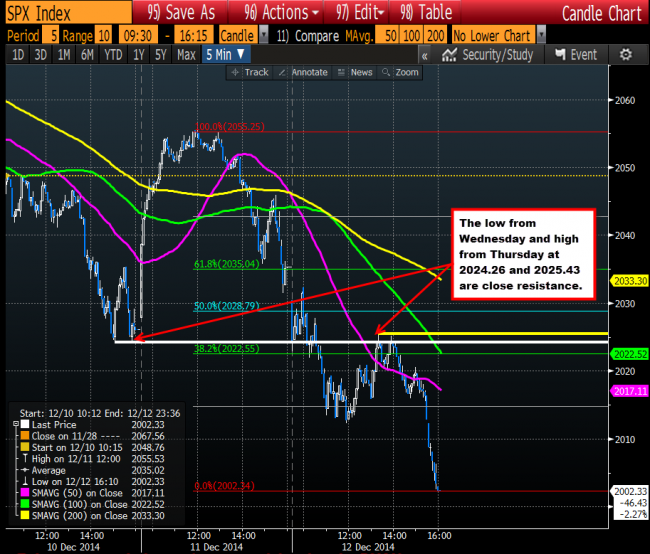
The SPX 5 minute chart. Stay below 2024.26 -2025.43 and bears remain in control.

