
The AUDUSD cannot shake the bearishness that continues to grip the pair. What would? (see post from yesterday:Forex technical trading: AUDUSD consolidating near the lows).
AUDUSD hourly chart and technical levels.
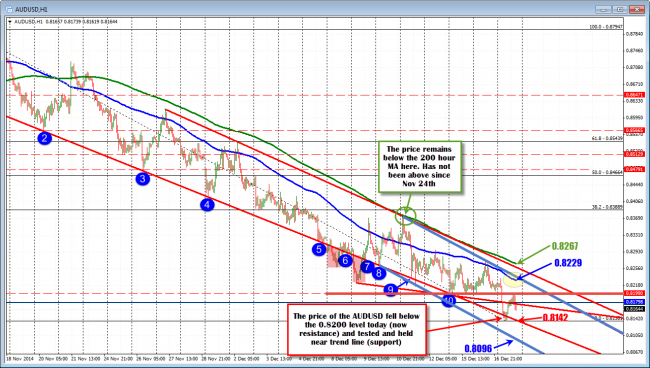
The closest topside resistance level is the 0.8200 level. This has been the floor this week. until the break below today. Now it becomes resistance.
A move back above the 0.8200 level is step 1. Above that the 100 hour MA/trend line (blue lines at 0.8229), then a move above the 200 hour MA (at 0.8267) are other hurdles to get the pair off the lows. Note that yesterday, the 100 hour MA was tested but could not sustain any upside momentum.
Any move above resistance, will then be eyed as support with a failed break reestablishing the downside trend.. Remember, Gov Stevens still thinks the AUDUSD is overvalued (he sees 0.7500 as more of an equilibrium level). That does not mean it has to go there tomorrow, but over time (it took 11 months for the AUDUSD to get the 0.8500 target he mentioned last year). So, the buyers have to prove they can take and keep control.
On the downside, although the market has been trending, the, pair has been following lower trend line levels (for the most part). Looking at the hourly chart, the trend line starting from the top left, had a few acceleration breaks below the line (follow blue circled numbers), but has been finding support along the original line (today the price fell briefly below but rebounded). That support trend line comes in at 0.8142 currently. A move below that level will target a lower, more recent channel (see blue trend lines) . That target support comes in at 0.8096 (see chart above). From there, the low from 2010 at 0.8066 will be eyed.
US dollar risk will be high during the FOMC decision this afternoon (so please consider that risk in your trading), but levels seem to be marked out for your trading going forward.

