
The SNB has played a hand and helped push the USDCHF and the EURCHF to the upside. What are the charts telling us now?
The SNB introduced negative interest rates on sight deposits today and that has helped push the USDCHF and the EURCHF quickly to the upside. The negative rates will be introduced on January 22nd, which is the date of the next ECB meeting when speculation is the ECB will continue their easing.
For thoughts and details on the move, required reading is found at the links below:
“Is the SNB front running the ECB and where is EUR/CHF going now?”
“The SNB is ready to take more measures if required”
“SNB had to intervene in FX markets in last few days says Jordan”
“SNB’s Jordan says they are committed to purchasing unlimited quantities of FX to enforce cap”
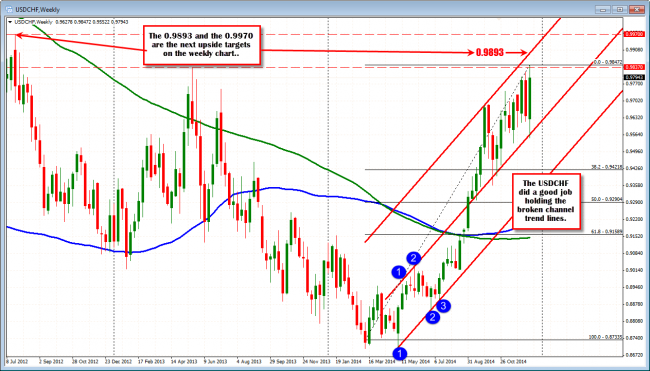
The Weekly USDCHF chart.
As far as the technicals go , looking at the weekly chart, the USDCHF tested and moved above the 2013 high at the 0.9837 level. The high reached 0.9847 but quickly scampered back below that old high (it stayed above the level for seven minutes in total). So there is some sellers who have been long the pair (or EURCHF) who are happy to let go with the quick jump higher..
The correction lower pushed the price back down to the 100 bar MA on the 5 minute chart (see blue line in the chart below – at 0.9773 currently), where buyers entered. That is good for the buyers/longs. Stay above and the buyers remain in control intraday.
Now, the move lower off the days highs, did take the price below the 50% of the days trend spike higher (at 0.9784 – see 5 minute below), but given the quick race, higher, there were probably some longs up[ there, who got nervous. I imagine little traded on the way higher. So those traders may have been washed out. What the holding of the MA does, is defines the risk on the downside. I would like to see the price stay above that level now. On the topside a move above the 0.9837-47 area will be the next target hurdle. Above that the 0.9893 is a level to aspire towards (see weekly chart above).
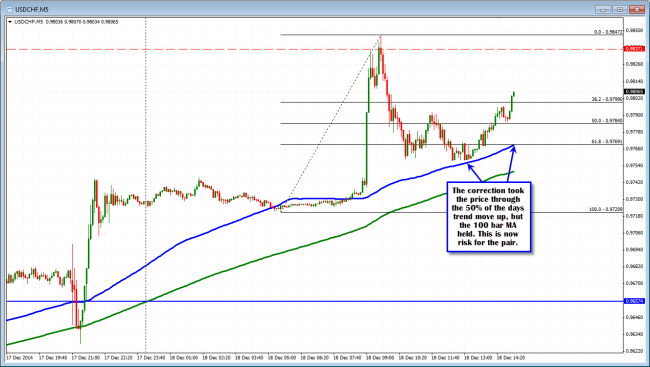
The USDCHF held the 100 bar MA on the 5 minute chart.
Looking at the EURCHF, the move higher was more pronounce on that chart (see 5 minute chart below).
Needless to say, the chart is proof that the giant is in the game and I would expect them to keep that advantage (or you would think they would). The rise higher, like in the USDCHF was quick and the correction off the high has not been a joy for those who bought in the top 38.2% (above 1.20599-65 area). However, the lows held above the rising 100 bar MA (blue line in the 5 minute chart below and if the price can stay above that level, all is well with the pair (and for the bulls/buyers).
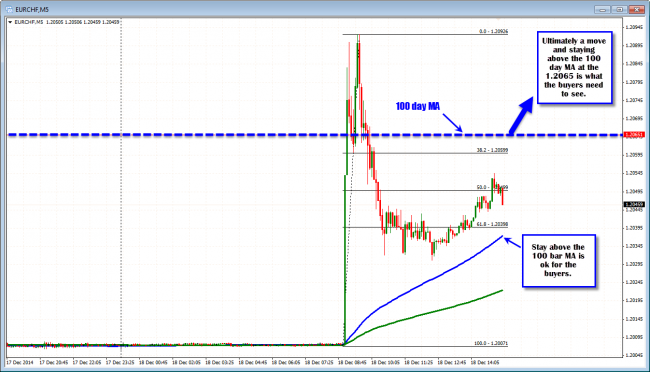
5 minute chart in the EURCHF
Although the 1.2000 level is further back in the rear view mirror, is it enough for the SNB to have it at that distance, or do they want to see the persistent bid into the CHF disappear and the pair to move even farther away?
The SNB has consistently had to lower inflation forecasts through the year (the estimate for 2015 is now -0.1%). A strong currency, weak oil and commodities just make it even harder. The currency should not be so strong but it is hard to fight the tide. With the ECB ready to act again as early as next month, they are swimming upstream. Add to that things like the Russia crisis and other flight into safety events (like stock flush outs) and the Pavlovian reaction is to park it in the CHF .
Looking at the daily chart of the EURCHF, the picture can be more worrisome for those who have lived through the last dip to the 1.2000 level. The move higher today was able to break above the 100 day MA but the price held below the topside trend line (see chart below). The price is back below the 100 day MA at the 120.65 level.
A move back above this level is needed to take some of the fear away from those traders who in the past, bought dips in the EURCHF all the way down to the 1.20003 level with no satisfaction Will they now face a similar creep back down? Will the crowded longs just keep a lid on any rallies? Be aware of the 100 day MA level. Get above it and the pressure is off for the creep lower. Stay below it, and the creep may begin to resurface.
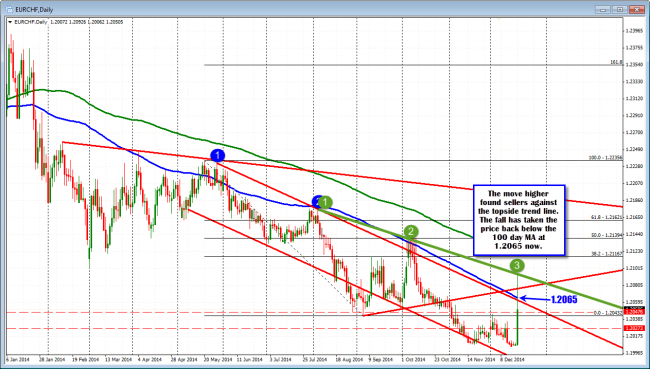
Daily EURCHF

