
Today, natural gas is tumbling and the story is in the news. The winter is not as harsh and the supply and demand is controlling the price and the trend down – according to the fundamental news stories.
What about the technical charts?
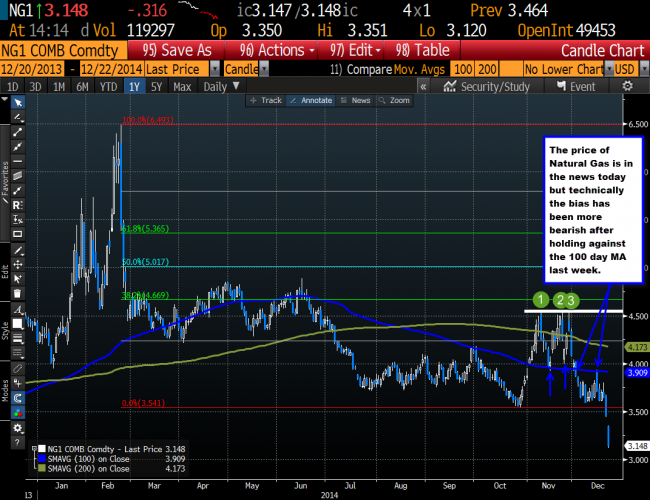
Natural Gas moving lower on fundamentals and the technicals
In November, traders leaned against highs with three separate peaks at the same area. The price declines off those highs came down and tested the 100 day MA (blue line in the chart above). In December, the price moved below the 100 day MA, and what was once support, became resistance. Last week, there was the big test. That test stalled at the MA line and the downside started to pick up steam. Friday and today, the price decline is more of a tumble.
What does this have to do with currencies?
Not much to be honest with you. I don’t know if there are a bunch of traders trading the price of Natural Gas vs the dollar.
The point is, however, that traders – in a lot of instruments -will use technical levels for trading clues, and also more importantly to define risk and limit risk. Sellers in November against the highs used the ceiling to define and limit risk. Buyers on the dips against the 100 day MA in November were defining and limiting risk. Those buyers turned to sellers in December on the break below the 100 day MA. They then used the 100 day MA again to define and limit risk on the topside. That test last week led to the tumble lower.
It helps to see what other traders are seeing. Like they say, “a picture is worth a thousand words” or in the case of traders, perhaps a $1000 – or some money at least ; )

