
The market is quiet and is likely to not get any better. The economic data is done for the US session. The stock market will have an abbreviated session.
What are some of the hourly/daily charts saying in the currency markets (even though I do not suggest trading – I really don’t ; ) )?
USDJPY
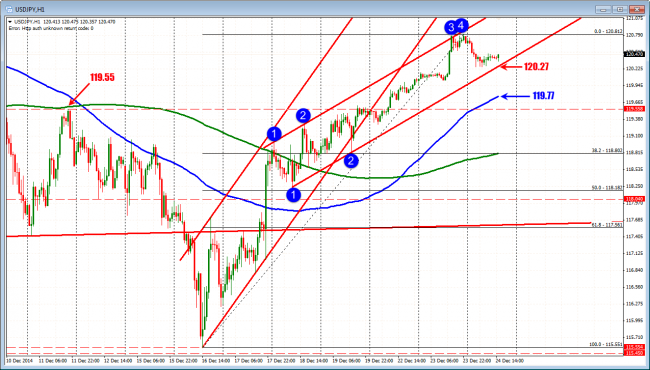
USDJPY trades between the channel resistance and support.
Yesterday, the USDJPY tested topside trend line resistance (see: Forex trading analysis: USDJPY tests topside trend line and holds the line ). The price has drifted down from that solid trend line and looks toward the sister line below at the 120.27 currently. A move below that will look toward the 100 hour MA (blue line in the chart above) at the 119.77 level. The price broke above the 100 hour MA after the Fed decision on December 17 and has not really been that close to it since. If the price wanders down there, look for buyers (I really mean, don’t do anything. There will always be another trade on a better day).
EURUSD
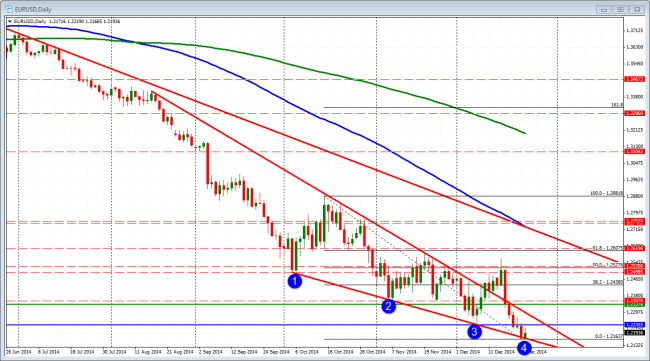
EURUSD daily chart.
The market put a good test on the lower trend line on the daily chart yesterday (see: Forex technical analysis: EURUSD tests lower trend line ) and it slowed the decline. Today the price rebounded a bit but the correction has been able to stay comfortably below the 100 hour MA (blue line in the chart below). On the way higher, it did break above topside channel trendline, but momentum has slowed.
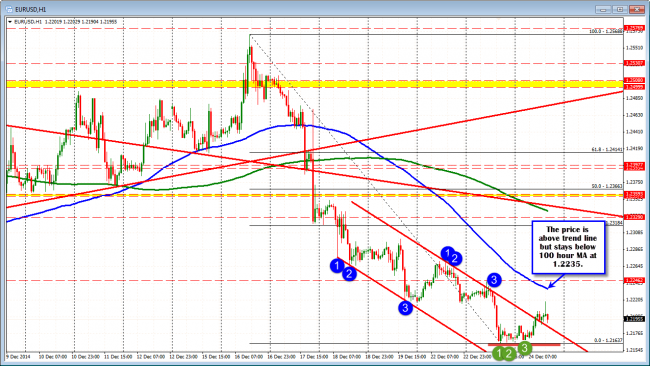
EURUSD-hourly chart
GBPUSD
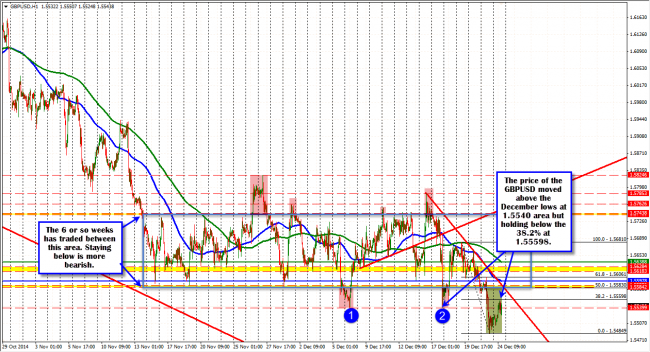
GBPUSD hourly chart.
The GBPUSD fell outside the blue box which has been where most of the trading has been taking place since mid-November (below 1.5583-89). The price also moved below the lows from December at 1.5549 area. Today the correction higher took the price above those lows but is finding initial resistance against the 38.2% retracement. What sellers would like to see is any correction find early sellers against the 1.5583-89 area. If they show up (going forward), that would be a clue the sellers are remaining in control.
AUDUSD
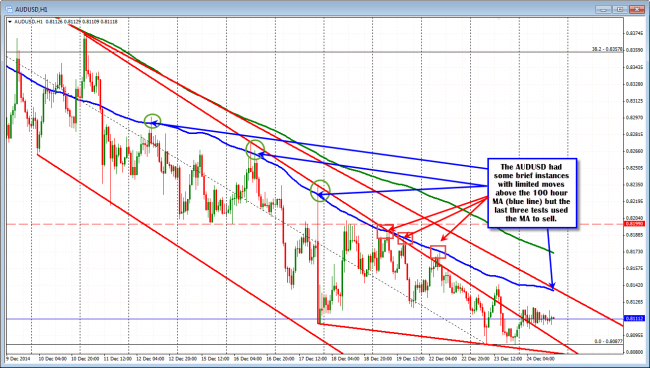
AUDUSD hourly chart.
The AUDUSD remains contained on the topside by the 100 hour MA (blue line in the chart above – see prior post Forex technical analysis: Keeps bearish as long as AUDUSD remains below the 100 hour MA ). The 100 hour MA currently comes in at the 0.8137 level. Stay below it and the bears remain in control.
That is how I see the charts, but I don’t expect much until the New Year is reached.
So you can look, but I don’t expect you to touch (that buy/sell button).

