
The price of copper has fallen to a 5 year low below $6000/MT on the London metal exchange. This represents the lowest level since October 2009. The price has been slumping on lower demand – especially from China.
The move lower in copper has also helped to contribute to a a sharp move lower in the AUDUSD today. The pair over that last few days – see chart below – had been correcting higher and made new year highs earlier today. However, that move has been reversed and we are now seeing a trend move lower in the pair.
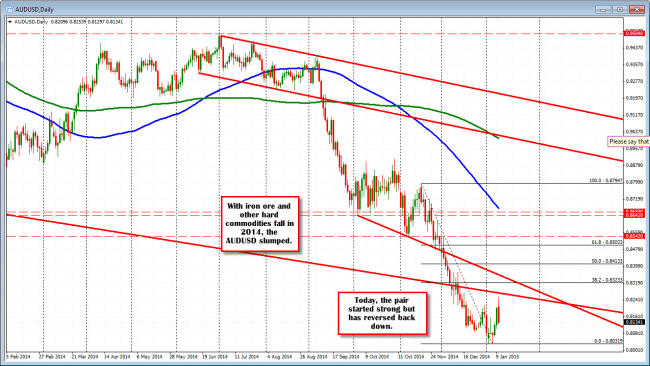
AUDUSD has been reversed in trading today.
Looking at the hourly chart, the pairs tumble is trend like, but it is testing some key support against the 200 and 100 hour MAs (green and blue lines at 0.8123 and 0.8128). On Thursday, the pair based against the 100 hour MA and moved higher (blue line) and on Friday, the 200 hour MA (green line) became the launch point.
As a result, I would expect support/profit taking buyers to enter. Risk can be defined and limited against the two moving average levels Note, however, that on a break, look for stops. The market is trending and trends can go on and on. Key support though.
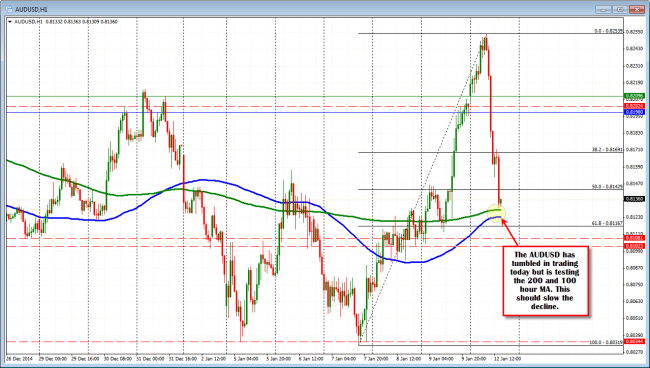
AUDUSD on the hourly chart is testing the 200 and 100 hour MAs (green and blue lines).
On a correction, keep an eye on the 0.8152 area. The 0.8152 was the low earlier today and the 0.81512 is the 50% of the last push lower. If the price cannot extend above this at a minimum, the sellers will remain in control and we should see another test of the key MA support.
A little battle is underway between the dip buyers against MA support and the trend sellers who want to inflict more pain on the buyers today.
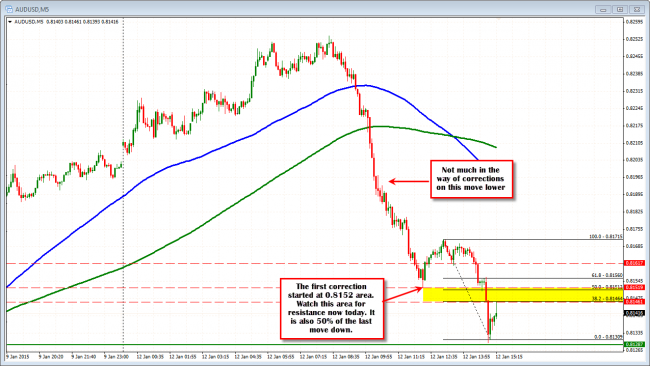
Resistance against 0.8152 now.

