
The USDJPY has continued the path outlined in the post earlier (see: USDJPY is not supposed to be doing this…).
The pair did find sellers in the 118.55-69 area as per the correction targets. The high peaked in the NY session at the 118.67 level. The pair trades near the lows from the Asian session at the 118.08 level. This is also near the lows from last week and the 50 day MA (thank you readers for that one). A move below the 118.00 level opens up the doors for further downside momentum – if it can be broken. So far, the support is holding.
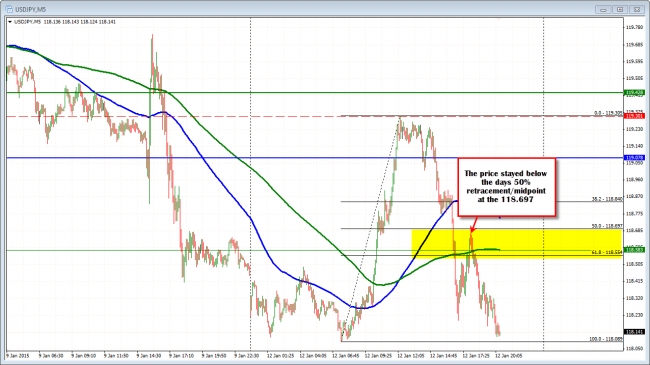
USDJPY tests the days lows.
If the 118.00 level can hold, the dynamics outlined earlier remain in focus.The 118.55-69 remains as first resistance. A move above those level will have the 100 hour MA and 38.2% retracement of the move down from the 2015 high at the 119.08 as the next key resistance. Earlier there was a look above this level. That failed (see hourly chart below).
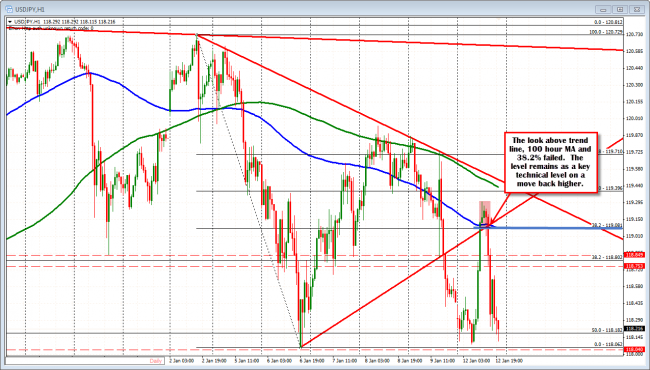
USDJPY remains a key resistance level.
Looking at the daily chart, a move below the 118.00 area has the pair looking toward the 117.20-43. These are lows from end of November and toward mid December. The December low – which extended down to 115.55 and just short of the 117.475 level (38.2% of the move up from October) – came on the back of the selloff in equities at that time and more illiquid markets as well.
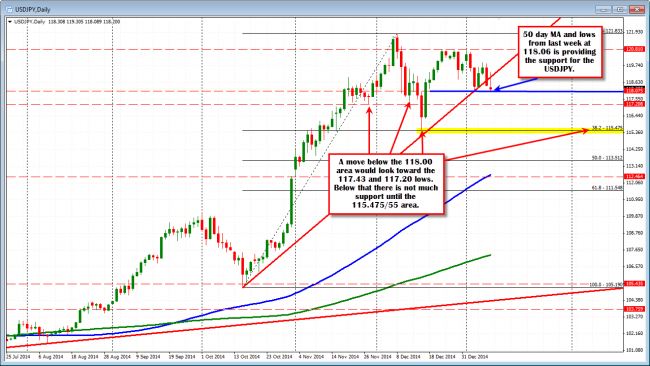
USDJPY on the daily chart.
The up and down nature of the market in trading today is speaking to the uncertainty of the market. Traders need to continue to be cautious. Sentiment can change quickly from bearish to bullish, back to bearish and then bullish. With good support below and levels above holding, the battle rages until a victor is crowned and you get a move away.

