
Gold has resumed the bullish bias in trading today as safe haven flows continue to dominate.
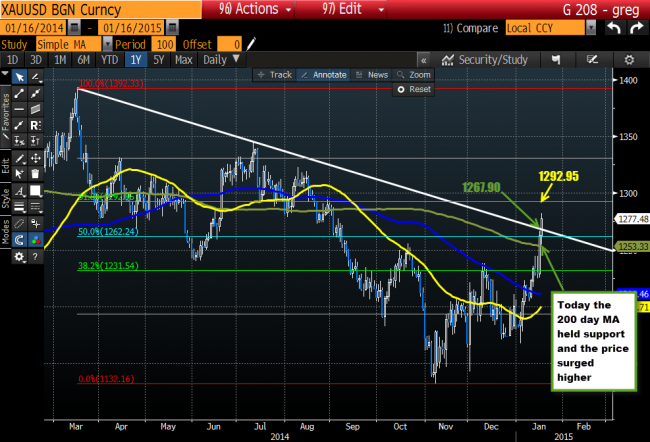
Gold daily chart
If you recall from yesterday’s post (see: Technical Analysis: Gold longs a big winner, but trend line looms not far away), the precious metal had moved up to test topside trend line resistance against the trend line at the 1268.48 level (the high reached 1266.85). In the process, it moved above the 200 day MA (green line in the chart above) at the 1253.54 level. This was the risk level for the longs as outlined in the post from yesterday. Stay above and the bulls remain in control.
Well today, in the Asian session, the price did find support buyers on a dip against that level (risk could be defined and limited) and the price based and started the bullish move higher today (the low got down to 1255.14 just above the 200 day MA at the 1253.32 level).
The surge higher has now taken the price above the trend line resistance from yesterday’s trade (see daily chart above) with the high reaching 1282.13.
With the price above the trend line and the 200 day MA, the bias was switch more convincingly to the upside from a technical perspective – at least on the daily chart. The next target off the chart is the 1292.95 level which is the 61.8% of the move down from the 2014 high to the 2014 low.
Are there closer upside targets or downside support levels to eye?
Looking at the 5 minute chart below, the high reached today banged against channel trend line resistance at the 1282.70 level (see green 2 on the top trend line). Traders who have been long today, seemed to have liked selling against the level before the weekend.
The price has more recently moved below the lower trend line at the 1277.98 level. So there is some additional squaring up and a more neutral market as a result of the break – at least at these levels and given the shorter term technicals.
Going forward now, if the price can stay below that broken trend line on the 5 minute chart, the shorter term bias is a bit more corrective/consolidative. The target below will be the 1271.82-1268.63 area. This is the 38.2-50% of the move higher today. If the more intermediate and longer term buyers are to remain in control, staying above these levels will be eyed for that technical clue.
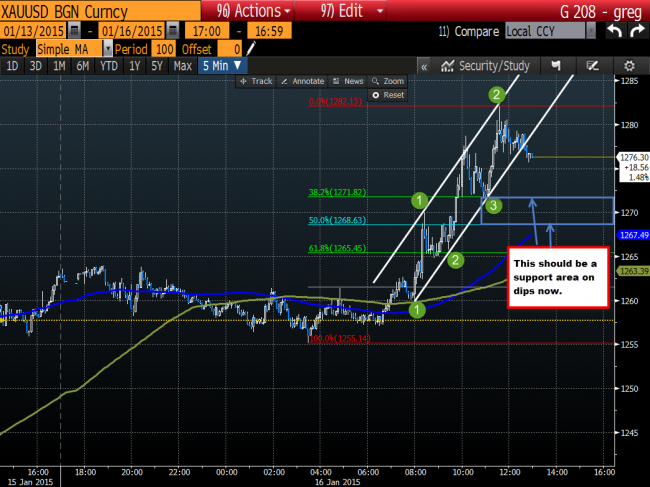
Gold 5 minute chart
Overall, given the volatility and uncertainty, gold has returned as a safe haven. Will it last next week if other markets like the US stock market shrugs off the currency markets woes?
It may, but it is probably too early to really tell.
Nevertheless, the good news for traders is the technicals followed a roadmap for the bullish move (i.e., it moved above the 200 day MA,to the trend line. Corrected to the 200 day and found support. Broke above the trend line and topped against channel resistance, etc.).
As a result, I expect the road left behind will provide equally as useful clues. So watch for the support levels outlined to give traders the clues. IF the price can stay above the support levels, the bulls remain in control and the worries are still there. If the prices move below the support level, perhaps the fears dissipate and the gold buyers don’t need to be buying anymore (trend line and 200 day MA will likely be key levels in next weeks trading).

