
The AUD is one of the weakest currencies in trading today. The pair is down against all the currency pairs with the exception of the CHF. The pair is being impacted by expectations of a potential rate cut as early as February.
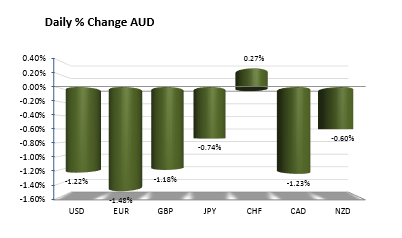
Snapshot of the AUD vs the major currencies in trading today.
Commodities continue to decline. The price of iron ore is trading at the lowest level since May 2009. Needless to say, the resource sector of the economy continues to feel the impact from China and global headwinds.
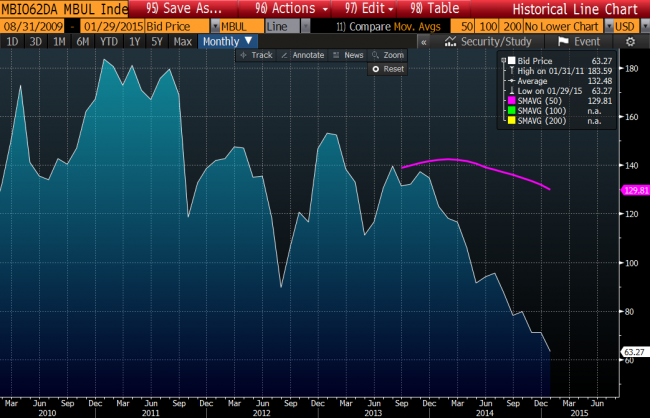
Iron Ore prices are trading at the lowest level since May 2009
With other countries cutting rates/stimulating, will the RBA be the next to fall in line just to keep up? The markets are pushing the AUDUSD with that thought in mind.
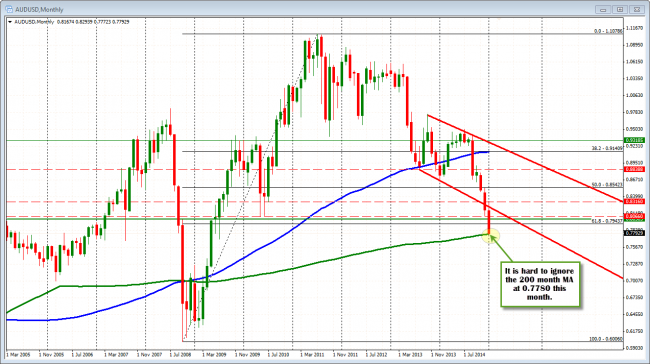
AUDUSD tests 200 month MA
What could possibly get in the way of that trend?
Technically, the pair tested and is trading near the 200 month MA (green line in the chart above) at 0.7780. The low today extended to 0.77723. The level is hard to ignore as a support level to lean against despite the bearishness seen in the other charts (see hourly chart below/also the commodity trends). So be aware that there could be dip buyers (with stops below) simply because risk can be defined and limited. PS on a break, remember that Governor Stevens, not long ago (Dec 11th to be exact), commented his level for the AUDUSD was 0.7500 (see: RBA’s Stevens says AUD should be closer to 0.7500 ). A break of the 200 month MA, might next target that level.
Looking at the hourly chart, today, there is nothing to suggest a bullish bias. The price action yesterday saw the price move higher and above the 100 hour MA (blue line in the chart below) after the higher than expected inflation numbers. However, post FOMC – and helped by a weak NZD from a dovish RBNZ – the price fell back below the MA level (blue line) with even more momentum. The selling intensified. The day is more of a trend down day with a range of 133 pips vs the 22-day average of 90. So it is tough to buy — except against that 200 month MA.
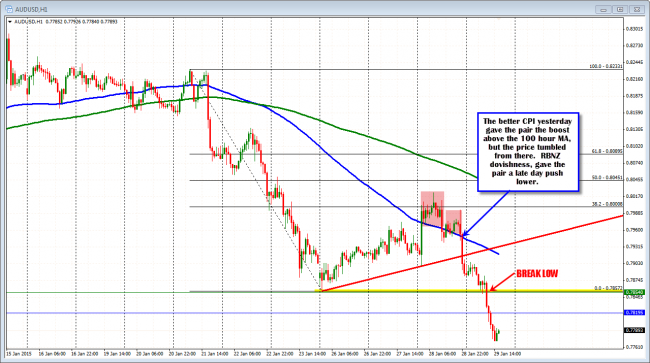
AUDUSD trending lower on the hourly chart today.
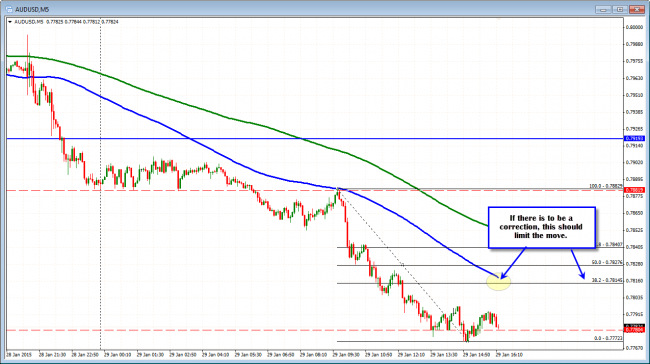
Drilling down even further, the 5 minute chart shows the trend characteristics. The chart shows a consolidation at the lows from yesterday (near 0.78829), a break below and then a test of the lows and the 100 bar moving average (blue line). The inability to move above that level was a key signal to sellers, to continue the trend to the downside.
Now, if the price is going to bottom, the upside will still be tested by resistance levels on corrections. To show that the buyers can take back control, a move back above the 38.2% retracement of the last leg down (starting from the 100 bar moving average) at the 0.78145 level will need to be breached. The 100 bar moving average (blue line in the chart below) is also nearing that level.
So bearish bias continues, with the 200 month MA the only obstacle in the way. Will it hold or will the traders start a correction? That is the question from this point.
AUDUSD trying to bottom but work to be done to get the AUDUSD out of the trend.

