
The US GDP was weaker than expectations, but consumption was higher. In fact, the consumption component contributed 2.87% of the total. Private investment also added 1.2%, but inventories were 0.82% of that gain (not always a good thing). Net exports and government were the negatives for the quarter with net exports subtracting -1.02% and government being a negative contributor of -0.4% (see infograph below).
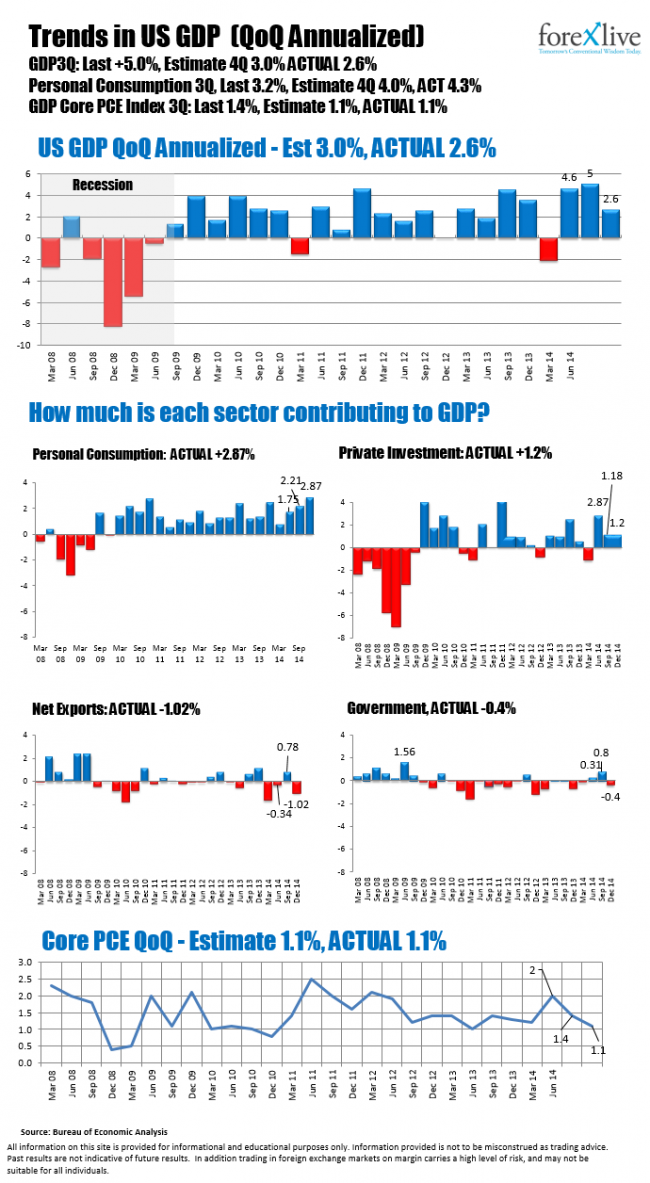
GDP breakdown
The USDJPY is moving lower on the data. The pair remains contained by the range seen over the last 9 trading days. The 117.17-32 is the extreme area where the Pavlovian reaction has been for the buyers to enter against the area. We know the pattern. Eventually, there will be a break. Look for stops, IF the level can be broken.
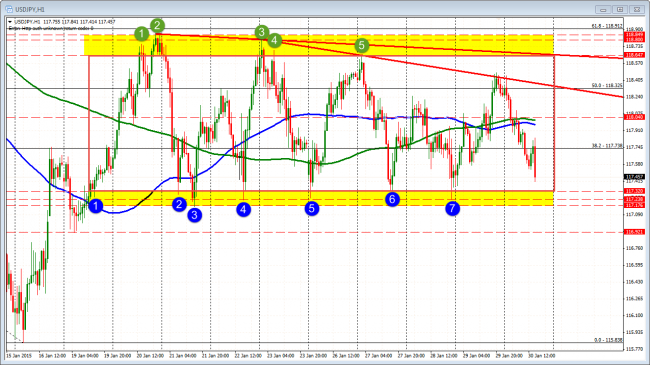
USDJPY moves lower on the weaker USD GDP
Looking at the 5 minute chart, the price trend has been down for most of the day. There was a move above the 100 bar MA (blue line) during pre-number correction. The pair is finding some support against lower trend line. The 100 bar MA (blue line) will be risk level for shorts who want to stay short. The level comes in at 117.70 and moving lower. A move above that level will give some concern for the shorts as the up and down consolidation is the focus.
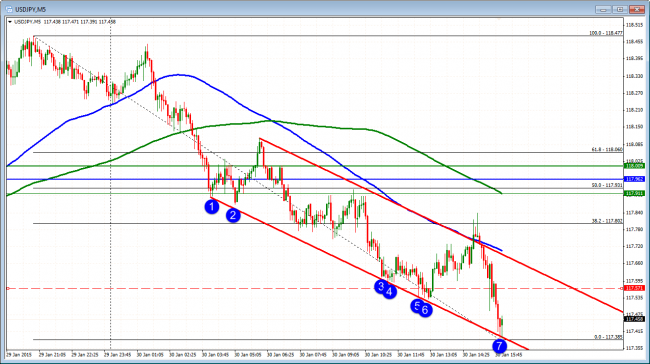
USDJPY 5 minute chart

