
Calling it, like I see it.
The price of bitcoin this week tumbled from the 50 day MA on Monday (white MA line on the chart below) at $14,439 to a low on Wednesday at $9,222. That is a pretty healthy fall.
On the way down, the price cracked below the 100 day MA (blue line) for the first time since September 15th. It also fell below the 50% retracement of the move up from the July 2017 low. That level comes in at $10,748. The 100 day MA on the day came in at $10,633.
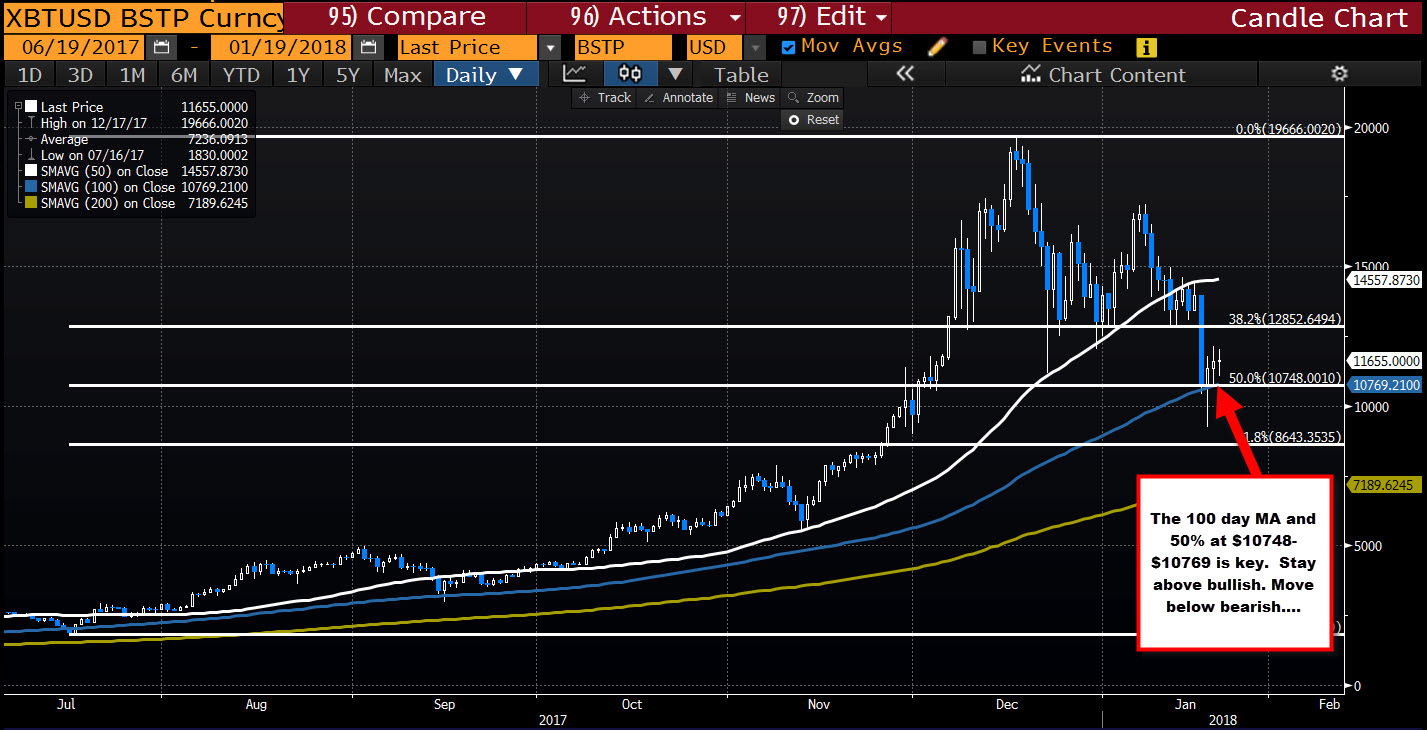
However, the fall below that MA and the 50% retracement, could not close below each key technical level.
Yesterday, the low came in at $10,693 (the 100 day MA was at $10,700).
Today, the low stalled at $11,054 with the 100 day MA at $10,768.
The one thing I can't ignore from the technical price action perspective, is that those technical levels could not be sustain a close below. They were broken, but the price could not close below the levels.
That is key for the bias for the digital currency today and going forward. Stay above is more bullish. Move below is more bearish.
Now with this cryptocurrency, anything can cause it to move back lower. Of course regulation can cause a hiccup at any time, but that sort of news has already been out there. Barring more of the same, the technicals could start to take back over and the price might start another run higher.
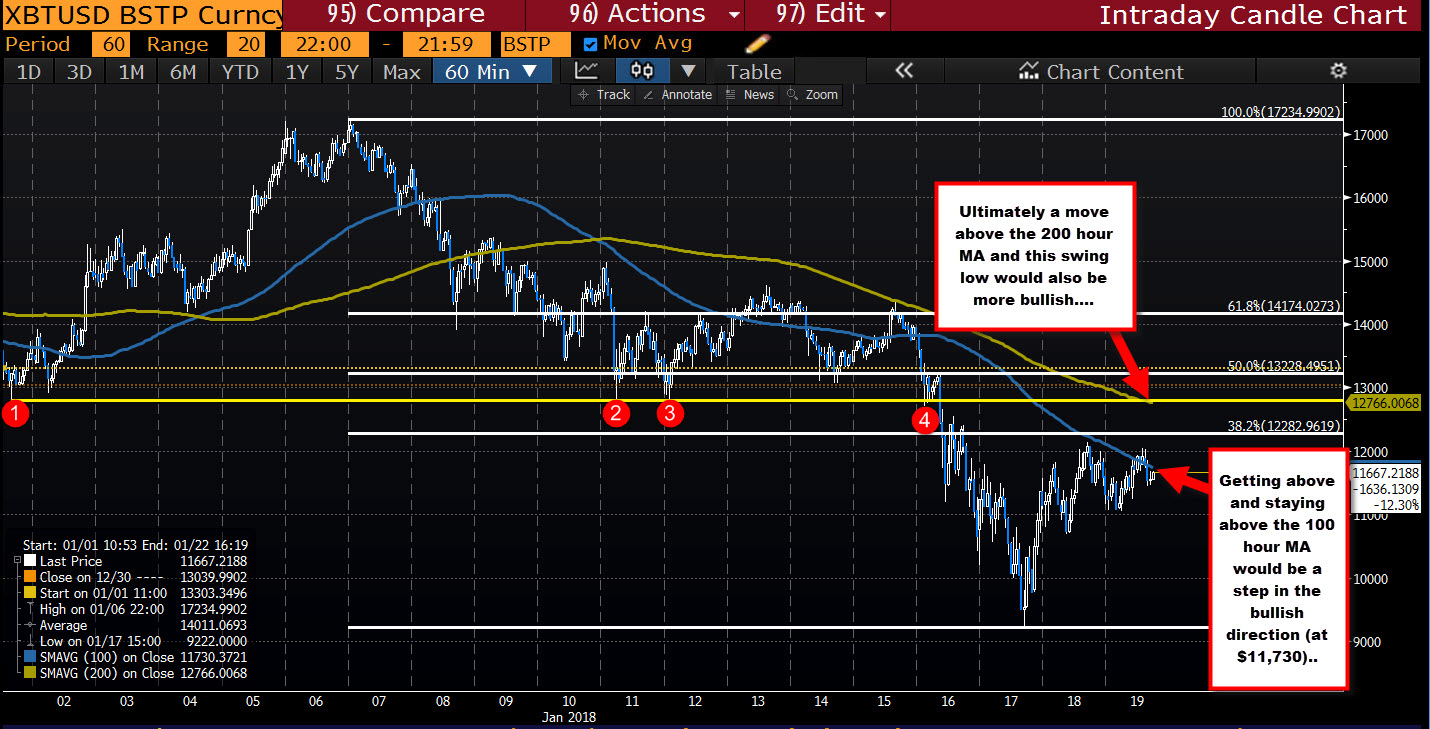
What would help the bullish case is if the price can get back above the 100 hour MA (blue line in the chart below) at $11,730. Get above and stay above that MA would be more bullish. We have traded above that level today but could not keep the momentum going. Ultimately a move above the 200 hour MA (green line in chart below) and the floor at $12,800 area would be another bullish development.
SUMMARY.
There is one thing that can't be ignored from a technical perspective this week. That is the inability to close below the 100 day MA and 50% retracement. As long as that condition remains, the buyers have an incentive to take the price higher.
If basing from that dynamic, a move above the 100 hour MA will be an important technical clue. That comes in at $11730 currently. Today the price went above but failed on the first look.
So there is a battle going on. The winner will be declared from which way the market pushes. Will it be above the 100 hour MA or will it be back below the 100 day MA and the 50% retracement. The battle lines are drawn.

