
Bears are in control with the digital currency down about $2000 in trading today
The price of bitcoin is lower on the Bitstamp exchange by about -$2,000 (yes -$2K). That is about a 14% plunge from the close yesterday. Ouch.
The fundamentals continue to be focused on the South Korea regulation and now China is talking the same. A lot of trading in bitcoin takes place in the Far East. Crackdowns on money laundering concerns are not good for the buying euphoria that drives the bitcoin speculators.
Looking at the price action, the low today fell to $11,191.59. The price has rebounded off the low and currently trades around $12,000. So things were worse and could be worse, but at -$2K, the longs are feeling a pinch today.
In addition to the fundamental story, there are some key technicals that are driving the price action.
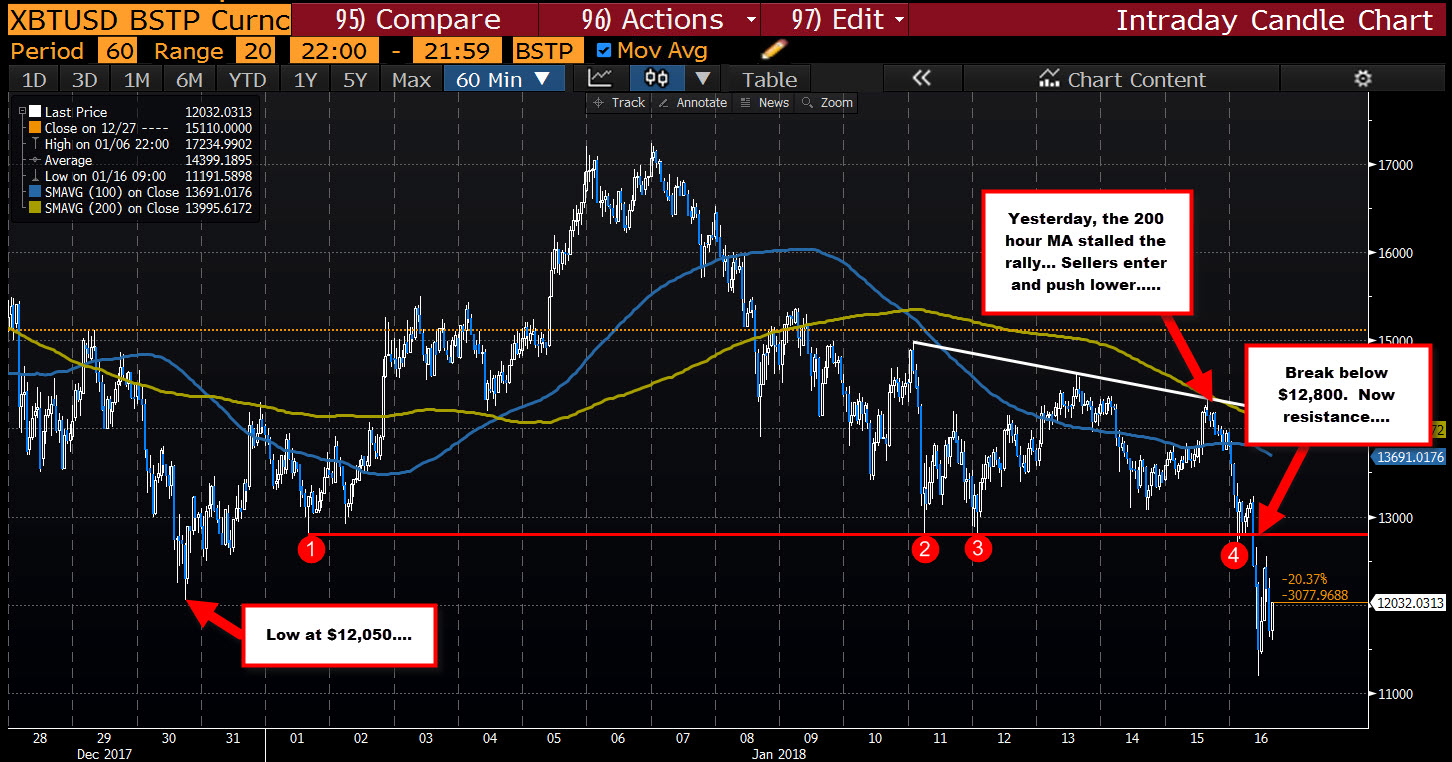
Looking at the hourly chart above, yesterday the corrective high stalled right at a topside trend line, AND the 200 hour MA (see green line and topside trend line). If you read my posts on bitcoin (and look at the charts), traders tend to use the 200 hour MA (green line in the chart above) as a key barometer (they pay attention the 100 hour MA too - blue line in the chart above). Bullish above and bearish below.
The holding of those technical levels on the correction higher yesterday, discouraged the buyers, and encouraged sellers to enter. BEARISH. That hold started the fall.
The other level of importance off the hourly chart is the $12,800 level (see red line and red numbered circles). That level was retested in early trading today, saw a small correction, then cracked below with momentum.
If the price is to continue to rebound today, getting back above that level will be a key level to get and stay above. The high correction so far today off the low has gotten as high as $12,553. So seller remain in firm control on the hourly chart.
Taking a broader look at the daily chart, what levels are important/in-play from a longer perspective (see daily chart below)? Who is in more control?
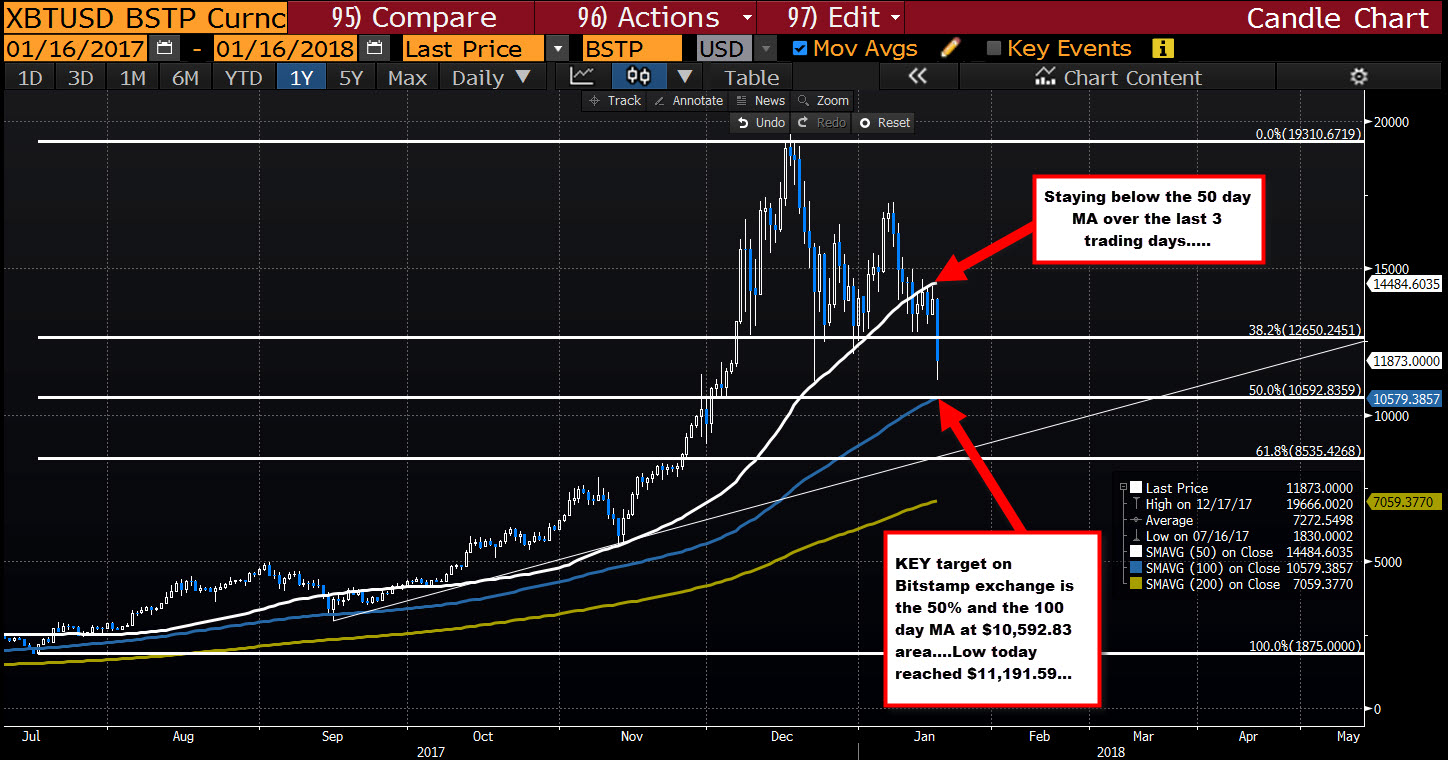
On the topside, the price last week traded above and below the 50 day MA (white MA line in the chart below - currently at $14484.60). The last 3 trading days has seen that level hold resistance (today the high did not get close to the level). That is bearish. Stay below keeps the sellers in control.
The other key level off the daily chart is the 100 day MA (blue line in the chart below) AND the 50% retracement. The price has not gotten to those levels, but should the selling continue, that area will be KEY.
The 100 day MA is at $10,579.38 while the 50% is close by at $10,592.83. That area is the next key barometer for the bulls and bears. Move below and there should be more liquidation. Watch out below.
SUMMARY: There are some key technical levels in play for bitcoin. The bears are holding the control on both the hourly and the daily chart, but BIG support below looms at $10,579-$10,592 area. If that level is broken, there could be some further liquidation as traders reassess the run up that saw the price get near $20K about a month ago. The catalysts are some regulatory fundamentals and some bearish technicals. When the two converge and tell the same story, traders need to be cautious. The good news is the technical levels are defining some key levels. Moves above resistance will change the bias - and could lead to the buying frenzy again. However until then, the bears remain in control.

