
Trades above and below 100 hour MA
The EURUSD today gapped higher on the Washington failures, That took the price back above the 100 hour MA (blue line in the chart below). The price fell from the higher opening, and in the process, back below the 100 hour MA. That fall tested the Friday end of day lows. From there the price based and rebroke back above the 100 hour MA.
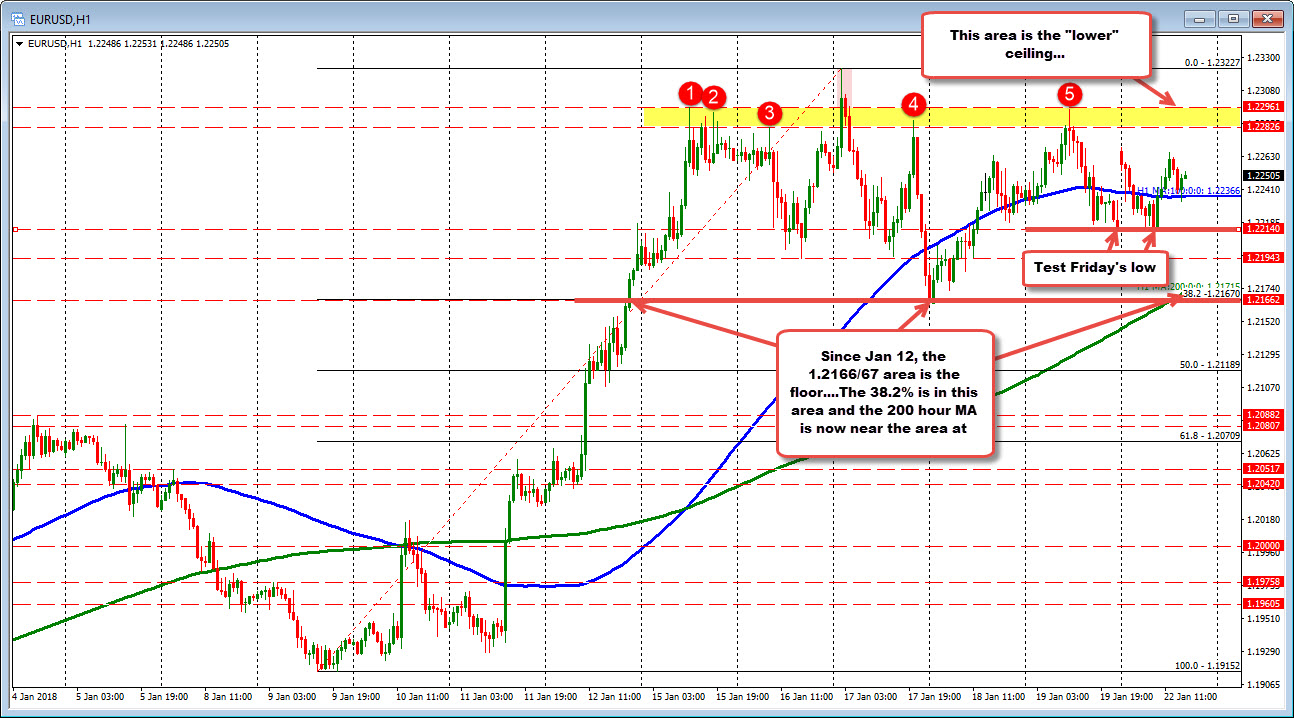
Since Wednesday of last week, the price has been doing a lot of waffling above and below the 100 hour MA barometer. The market is unsure of the next directional bias for the pair.
Going back to January 12th, the broader action is showing that the price has been trading above 1.2166 on the downside, and mostly below a ceiling at 1.22826-1.2296 (there is a higher extreme but that was brief). In between those extremes, sits the 100 hour MA - now at 1.22366.
Staying on the hourly chart, the 1.2167 is the 38.2% of the move up from the Jan 9th low. The 200 hour MA has now caught up to that area and is at 1.2171. That adds to the levels importance.
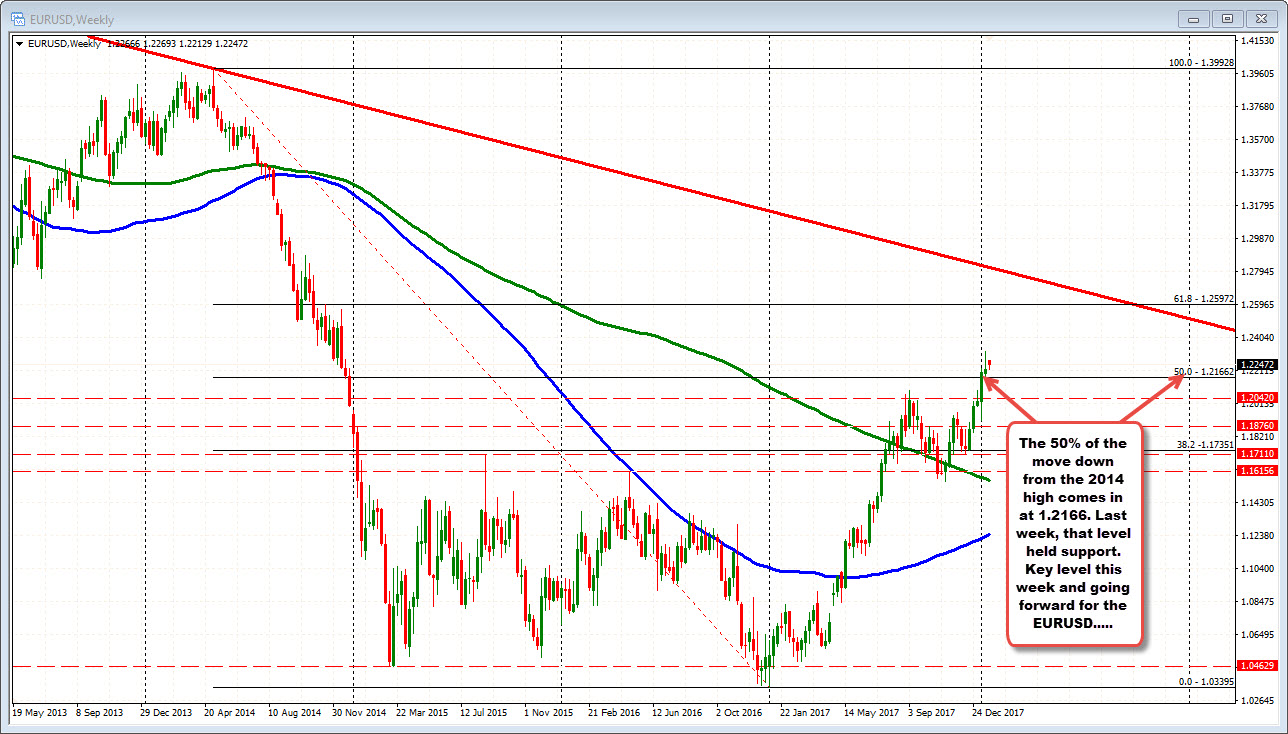
Going to the broader weekly chart below, the 1.2166 level is the 50% of the move down from the 2014 high. As shown on the hourly chart above, that level held support on the dip. Technically it is a key bullish above/bearish below barometer on the weekly chart. Staying above, keeps the bulls firmly in control.
Anything of note from the daily chart?
Looking at the daily chart, the pairs consolidation at the high is also above a channel trend line. That line cuts across at 1.22098. The low today stalled ahead of that level (see chart below).

SUMMARY. The market is consolidating with lots of ups and downs. However, the price right now is above the 100 hour AM at 1.22366 (bullish). That could change intraday but right now the buyers are more in control. Longer term, the price is - and has stayed - above the key support on the longer term chart at 1.2166 since breaking on January 12. That is also bullish.
On the topside, there is a key ceiling from the hourly chart at the 1.2282-96 area. Get above and it should lead to more upside momentum. On the first look, however, expect some profit taking.
A move below the 100 hour MA would target 1.2214 (floor from Friday and today).

