Lower trend line stalls the fall too
When I look at the 4-hour chart of the EURUSD, I see a key Bullish/Bearish Line that should be a barometer for the market from these levels. That "line" comes in at 1.2295 to 1.2300. The 38.2% of the move down from last weeks high comes in around that "line" as well.
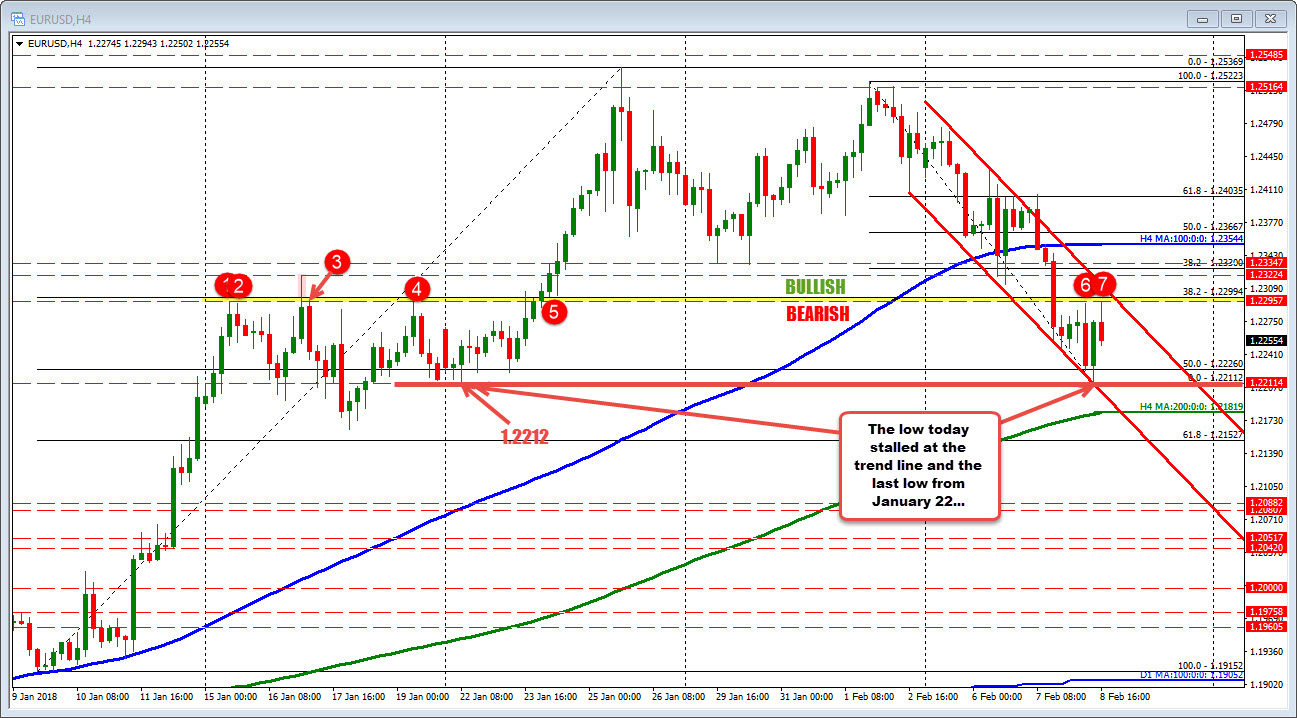
ON the downside, connecting the lows stalled the fall today. Also holding the floor was the swing line going back to January 22 at 1.2212. The price did dip below the 50% of the 2018 trading range at 1.2226. That too may come in play on continued weakness in trading today.
That is a broader picture.
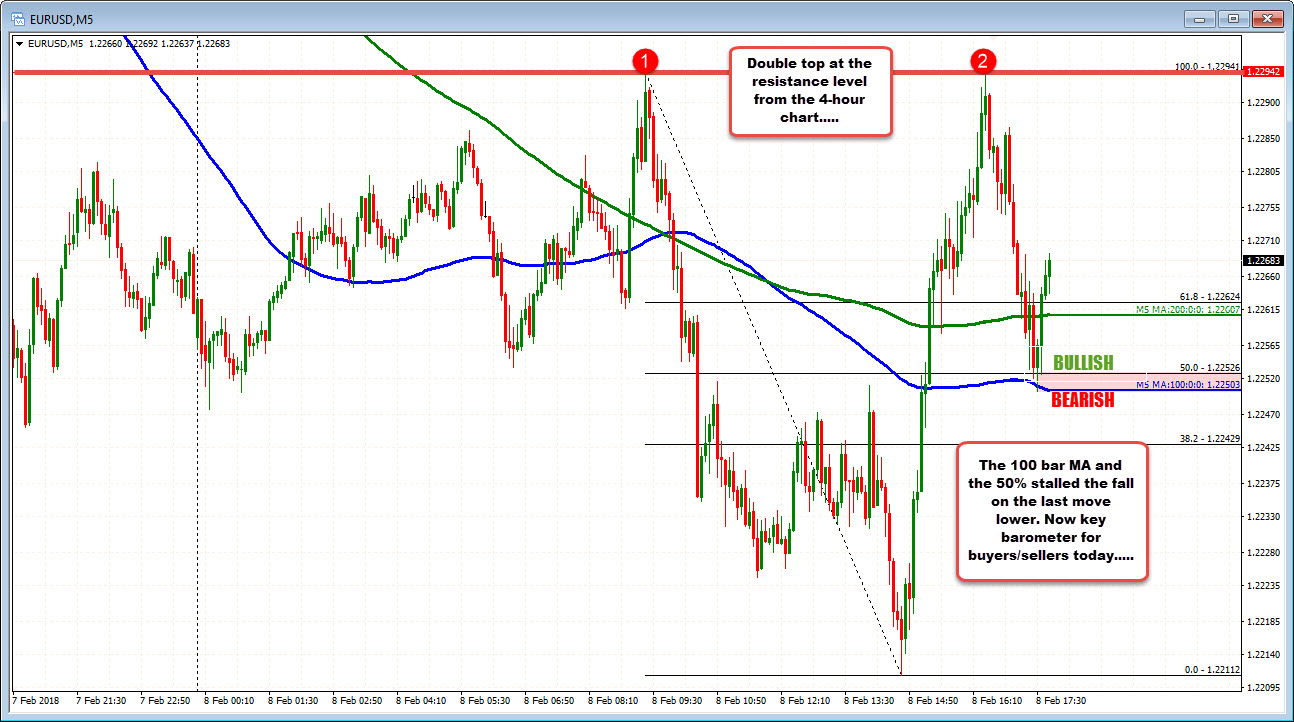
Looking at the 5-minute intraday chart below, the price action is up and down. The pair closed at 1.2261. We trade around that level. There is a double top at 1.2294. Again that was near the Bullish/Bearish Line. The level held twice today.
On the downside, the price did stall at the 100 bar MA on the last dip. That was also near the 50% of the day's trading range. Call that area (around 1.2250) an intraday barometer for bullish/bearish. Stay above keeps the bulls in control. Move below and I think, the buyers become more interested in selling.