Forex news for New York trading on Sept 12, 2017:
- S&P and Nasdaq close at record levels. Ho hum. Indices rise even though Apple is lower.
- JP Morgan Dimon: I think rates need to go up
- Jaime Dimon has harsh words for bitcoin: Bitcoin will eventually blow up
- Sen. GOP Leader McConnell. Getting Congress to give up the debt ceiling to be challenging
- Crude oil futures settle at $48.23 /BBL up $0.16
- USDCAD moves above the 100 hour MA. Staying above.
- JP Morgan's Dimon: US economy doing fine at 2%
- US sells 10 year notes at a high yield of 2.18%
- EURUSD hanging near the midpoint of the move up from the August low
- German FM Schaeuble: Trusts ECB Draghi
- US EIA cuts forecast for 2017 world oil demand growth by 70,000 BPF
- European major stock indices mostly higher with the UK FTSE lagging
- UK Finance Minister Hammond: It may be that goods trader w/ EU might be tougher
- The USDCHF rallies to topside trend line and stalls
- Ray Dalio: It would be terrible if Gary Cohn left
- US JOLT openings 6.170M vs 6.000M estimate
- ECB Constancio: Speaks about keeping sufficient monetary policy accommodation
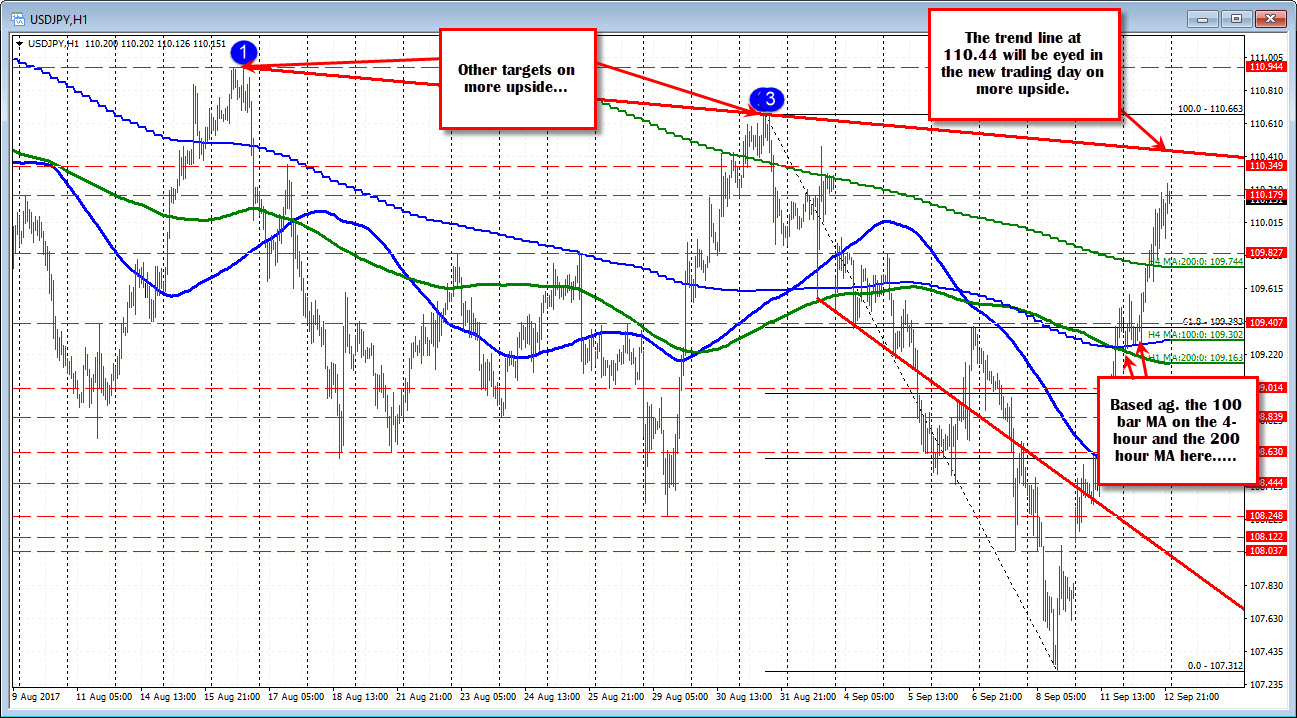
- Forex technical analysis: USDJPY starts to work on last weeks weekend gap
- Nigeria would not consider reducing production until March 2018
- More Mnuchin: Does not know if 15% corporate tax rate is achievable
- Mnuchin says Yellen being considered along with others for Fed chair
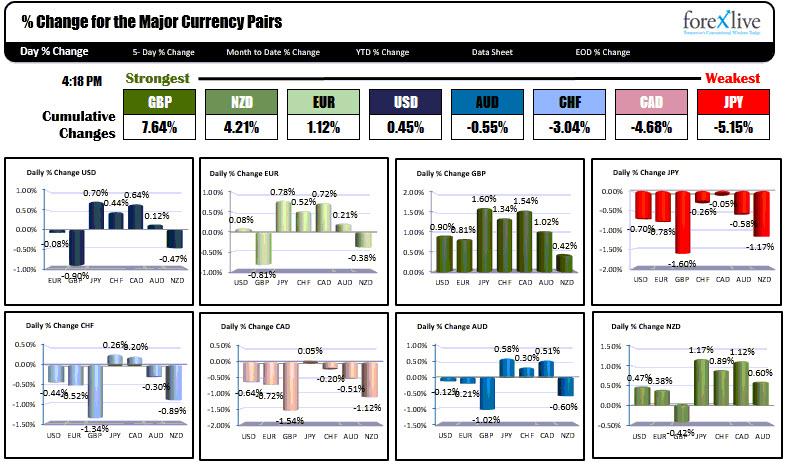
- GBP leads the way after inflation data. JPY weakness continues.
In other market today:
- Spot gold rose $4 to $1331.40
- WTI crude oil is trading up $0.33 to $48.40
- US yields rose for the 2nd consecutive day. 2 year 1.3348%, up 1.6 bp. 5 year 1.745%, up 3.6 bp. 10 year 2.1655%, up 3.5 bp. 30 years 2.7715%, up 2.8 bp
- US stocks ended higher with the S&P up 0.34%. Nasdaq up 0.34%. Dow up 0.28%
Another quiet day from the economic front and with the Fed officials in a blackout period before their interest rate announcement next week, there is not a heck of lot to go on .
There was one piece of US data out today. The JOLT job openings did come in better at 6.17 million vs 6.0 million estimate but it did not have a big impact at the time. In fact, the dollar moved a little lower bored moving higher after the report.
So what did move the market? What caused the GBP to race higher and the JPY to move lower?
The GBP was inflated today on the back of higher UK inflation before the NY opening. However that rise, needed a correction first. In the early NY session, the price action saw the GBPUSD move lower to test some support on the daily chart by the underside of a broken trend line at 1.3237 (see post here). When that level did find buyers near the level, we did see a move back up toward 1.3300 in the NY afternoon session. Overall, however, give the credit to the UK inflation data. The GBPUSD trades at the highest level since September 13, 2016 - almost 1 year ago to the day.
The JPY was another currency that got hit in the Asian and London session and continued that trend in the NY session. Of course when the JPY falls, the JPY pairs all move higher. Yesterday, the JPY pairs moved higher on higher interest rates and less fear from both N. Korea and the impact of hurricane Irma. Today there was additional momentum selling. What was lacking in a fundamental story today, was replaced by more favorable technicals for the JPY pairs. For the USDJPY - as an example - the price based early in the Asian session at the 200 hour MA and the 100 bar MA on the 4-hour chart at around 109.31. Buyers pushed the price higher. In the NY session, the pair eventually moved above its 200 bar MA on the 4-hour chart at 109.74, and that was good enough for another run higher to an intraday high of 110.248. An overhead trend line does loom ahead at 110.44 in the trading day. Remember that level.
The EURUSD traded higher in the early NY session but stayed within the range for the day (the Asian high was at 1.1978 and the NY session high stalled at 1.19734). The pair sits between the 100 hour MA at 1.2989 and the 200 hour MA below at 1.19446 (see post).
The USDCAD moved above its 100 hour MA for the first time since August 31. That MA comes in at 1.21445. Is it the end of the bear run? Well, the high after the surprise BOC hike did trade up to the 1.2240-50 area. The high today could only get to 1.21875. Yes we are above the 100 hour MA, but that is because the 100 hour MA fell and caught up with price. So going forward, if the price can get above 1.2200, get above a broken trend line at 1.2223, get above the 50% of the move down from the pre-hike high at 1.22377 and then the 200 hour MA at 1.2275 those would be steps for "more bullish". Those are a lot of steps. In contrast, for the bears, get back below the 100 hour MA at 1.2144, and the talk of bullishness, will be replaced with "we are likely to go retest the lows again". CLICK HERE.
Below is a snapshot of the % changes of the major currencies vs each other.