
Forex news for New York trading on September 27, 2017.
- US stocks love Trump/tax reform. Nasdaq and small caps outperform
- RBNZ announce no change to cash rate, as expected
- NAFTA 3rd round of meetings ends. Some comments.
- Fed's Bullard. Feds forecast lacks credibility w/ financial markets
- Crude oil futures ended the day up $0.26 to $52.14
- Speaking of stocks being stretched... Russell index racing higher
- Feds Bullard: US labor market probably as good as it gets
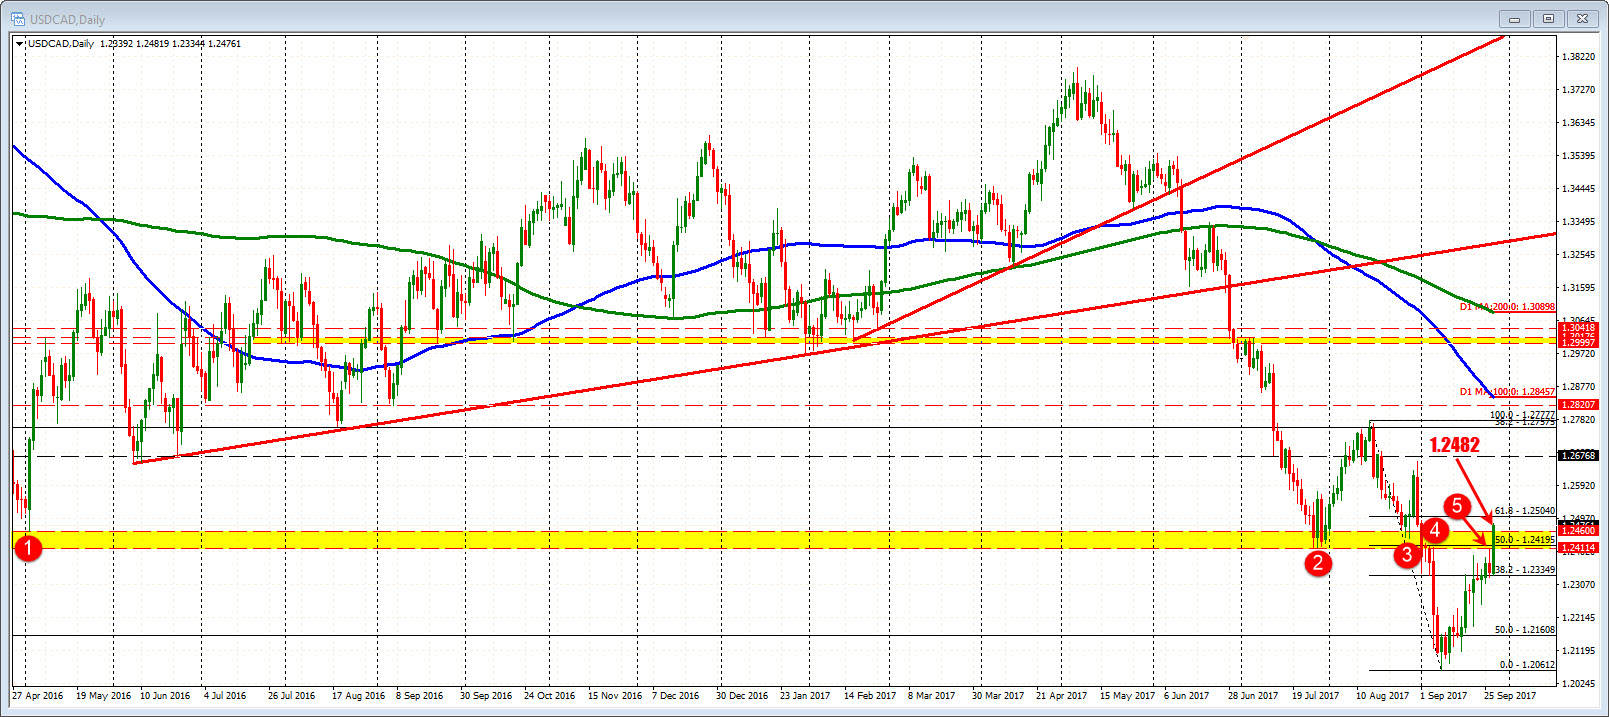
- USD/CAD rises to fresh high, nears downtrend resistance
- US 10 year yield is up to 2.30% and trades at the highest since early August
- CIBC: Bank of Canada won't hike until 2018
- Fed's Bullard: Fed funds rate is appropriate, inflation unlikely to rise in 2017
- If you believe in tokens and cryptocurrency, here is the stock to buy today
- BOC's Poloz: Over next 12 months, much of the temporary factors holding down inflation will dissipate
- Forex technical analysis: EURUSD swings higher off some key support.
- Poloz sounds far more neutral than what's priced into the market
- ECB's Draghi cancels London speech scheduled for Friday
- BOC's Poloz: Won't be mechanical on rates, will proceed 'cautiously'
- European stocks end the session with gains. Yields higher.
- What to expect from BOC Governor Poloz - 3 views
- Republican tax cuts won't be retroactive - report
- Atlanta Fed GDP tracker ticks lower
- EIA weekly US oil inventories -1846K vs +3100K expected
- August US pending home sales -2.6% vs -0.5% expected
- Goldman Sachs bumps Q3 US GDP estimate
- Is USD still a safe haven currency? - BofAML
- August prelim US durable goods orders +1.7% vs +1.0% expected
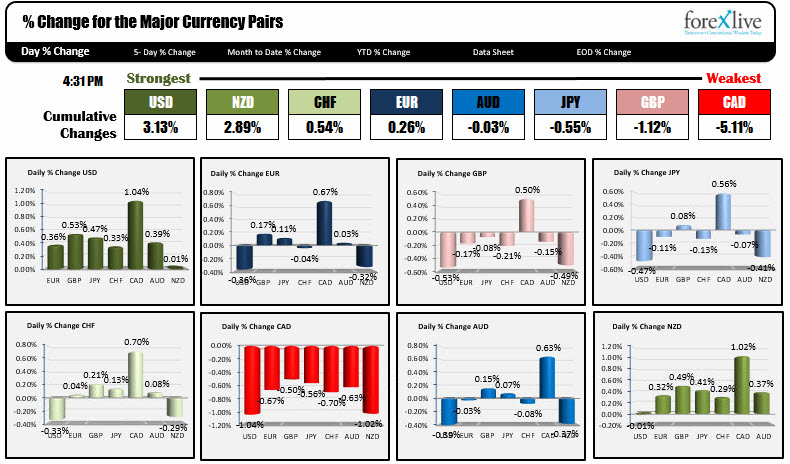
- The USD is the strongest currency, the CHF is the weakest as NA traders enter
In other markets near the end of the trading day:
- Spot gold fell on the stronger US dollar. It is down -$11.60 to $1282.58
- WTI crude oil is up $0.15 or 0.29% to $52.03
- US stocks ended the day with good gains. S&P up 0.41%. Dow up 0.25%. and Nasdaq up 1.15%. The small cap Russell 2000 surged by 1.9% and closed at a record level.
- US bond yields closed sharply higher. 2 year 1.4747%, up 3.9 bp. 5 year 1.9055%, up 4.7 bp. 10 year 2.3085%, up 7.2 bp. 30 year 2.8617%, up 8.7 bp
The Bank of Canada's Poloz said that he had no inclination for the central banks next rate move. That came a day after the Canada FM was more hawkish. The counter point from the more important central banker, helped to push the loonie sharply lower (USDCAD higher by 1.04% on the day) and make the the CAD the weakest currency of the day.
For the USDCAD, the price moved above the 1.2411 to 1.2460 resistance area on its way to a session high at 1.2482. That area was home to swing levels going back to May 2016 and July 2017. Earlier this month that area was broken to the downside, carving new lows going back to May 2015. PS the 200 week MA on the USDCAD is up at 1.2463. With the price at 1.2471, we are above that level.
While the CAD was the weakest currency today, the USD was the strongest. Although higher, the green back did give up some of their gains after an early run up on the back of better than expected durable goods data. In other data today, the US pending home sales data was not so great.
The EURUSD trended lower in the Asian and into the the NY morning session, but for this pair it ran into some pretty strong support at the 1.1711-20 area. The swing high from August 2015 at 1.1711, the 200 week MA at 1.1718. The 38.2% of the move up from the June low at 1.1720 all came in between the 1.1711-20 area. The low for the day stalled at 1.1716. The move to the upside reached 1.1776 before settling between the middle of the move up from the low at 1.1746. The 1.1711-20 remains a key level on the downside with a break likely triggering stops. On the topside a move above the 1.1772 -76 area could solicit a retest at some point of the 1.1822-27 area. That was the low extreme of a range that confined the pair for the last 4-weeks. If the bears are to remain more in control, that level cannot be rebroken (on the topside).
The USDJPY was another pair that saw the dollar move higher early, only to rotate back down. The pair broke above a resistance area that defined a peak back in July. That area came between 112.815 and 112.93. The high price extended up to 113.25 on the bullish break higher. However, that break failed later in the NY session, and the pairs price tumbled to 112.36 - 100 pips lower. The pair rebounded but stalled at 112.88 - between that 112.815 to 112.93. In the new trading day, stay below the 112.815 to 112.93 and the bears are happy. Move above and the technical story changes. you watching
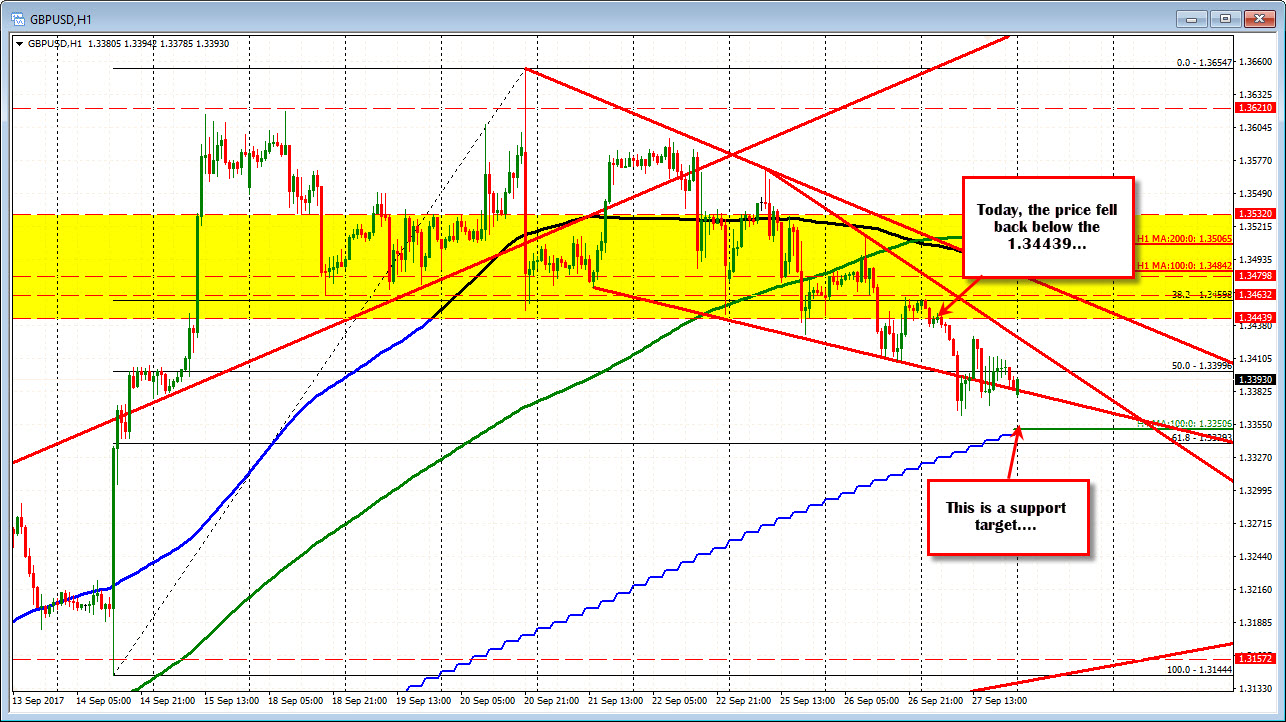
The GBPUSD was lower but form the NY session traded up and down. On the daily chart, the pairs spent most of the day below the 1.34439 level. Remembering from other posts this week,the 1.34439 was a swing high from post -Brexit (September 2016 high). The other two highs from June and July 2016 came in at 1.3532 and 1.3479. In the Asian session the price moved below the 1.34439 level and stayed below (see chart below). The 100 bar MA on the 4-hour chart comes in at 1.3350. If it goes below, the bias turns more bearish.
At the end of the day, the RBNZ kept rates unchanged. The pair on Tuesday fell below its 100 day MA and the 50% of the move up from the May low at 0.71874. However, momentum could not be sustained down to the key 200 day MA at 0.71482. The RBNZ decision did not do anything to push the pair outside the MAs (either higher or lower). So we sit between the 100 day MA at 0.7148 and the 200 day MA at 0.72459 and wait for the next break.

