
Forex trading news for trading on September 8, 2017.
- US stocks end the session mixed. Dow up. Broader indices lower.
- CFTC Commitment of Traders: Euro long position is the largest since May 2011
- EURUSD peaks at 38.2% of move down from 2011 high this week
- US consumer credit for July $18.499 vs $15.0B estimate
- US crude oil futures settle at $47.48/BBL. Big down day.
- What are the key events and releases for next week's forex trading
- Irma strengthens in latest NHC forecast
- Some steps you can take to try and protect yourself from the Equifax data breach
- Baker Hughes total rig count for current week 944 vs. 943 last week
- The close for USD/JPY today will be huge
- Why the drop in copper prices is a good sign
- Atlanta Fed GDPNow Q3 forecast bumped to 3.0% from 2.9%
- Russia to regulate cryptocurrency market, Finance Minister says
- New York Fed Q3 GDP Nowcast lowered to 2.1% from 2.2%
- Oil quickly drops 60-cents
- House Democrats and some Republicans pass Harvey aid and debt ceiling bill
- Caixin: China plans to shut local Bitcoin exchanges
- Fed's Dudley: Economy might be gathering strength a bit
- July final US wholesale inventories +0.6% m/m vs +0.4% expected
- Canada capacity utilization for 2Q comes in at 85.0% vs 85.0% estimate
- Canada August employment +22.2K vs +15.0K
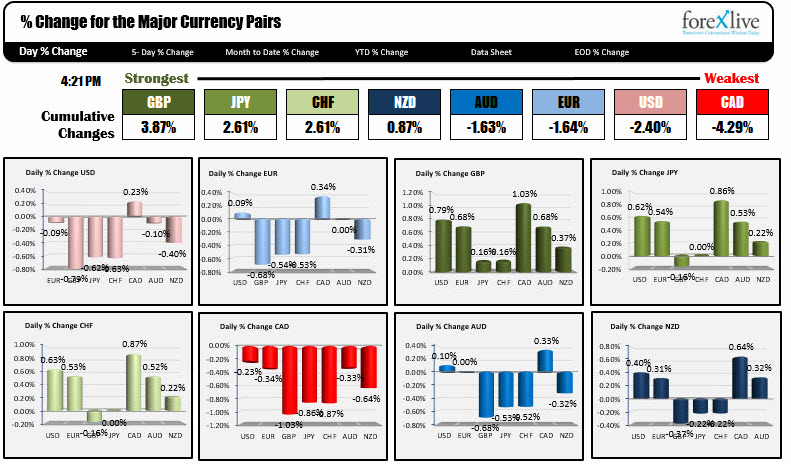
- Dollar continues its fall. Weakest currency of the day. NZD strongest.
The snapshot of other markets at the end of the week shows:
- Spot gold is trading down -$2.61 or -0.19% to $1346.75.
- WTI crude fell on the back of expectations of weaker demand after Hurricane Irma. The price is ending down -$1.50 or -3.10% to $47.57
- US yields are ending the day with modest gains after reaching the lowest levels since November 2016 in the 10 and 30 year instruments. 2 year 1.2620%, unchanged. 5 year 1.6332%, up 0.8 bp. 10 year 2.0507% up 1.1 bp. The low reached 2.0144%. 30 year bond 2.6707%, up 1.3 bp. The low reached 2.633%. The high for the 30 year peaked at 3.21% in March.
- US stocks ended the day mixed. The narrow Dow ended with modest gains but the tech heavy Nasdaq fell by -0.59% and the S&P index fell by -0.15%.
The dollar was the weakest currency today, but it was not the greenback this time. Instead it was the one with a loonie on it. The Canadian dollar (CAD) which has been on a tear higher this week as a result of the Bank of Canada tightening on Wednesday, was the weakest currency today.
The catalyst?
The Canadian employment data came out and although it did not look so bad at first with a gain of 22K jobs vs 15K estimate, the market turned the currency around after the breakdown showed the lower paying part time jobs rose 110.4K, and the better paying full time jobs lost -88.1K. The CAD started to get sold.
In reality, the number was not all that bad. The Unemployment rate fell to 6.2% from 6.3%. That is the lowest level since September 2008 and prior months had a better mix (only 2 of the last 9 months saw full time jobs less than 0). However, the CAD was a bit overbought and technicals can turn the market around (they really can - see post)
For the USDCAD, the gains erased the Asian session fall that saw the price move to the lowest level since May 2015 to 1.20612. The rally took the price above the 50% of the move down from the post-BOC high at 1.21527. That his about where the pair is closing today.
Not one day does not make a trend and to be honest the the pair fell 600 pips from August 31. A 100 pip rally off the low is not the end of the bearish world, but the CAD selling today was enough to get it off the peaks it has been making against all the major pairs post the BOC hike.
The USD did end down against all the other major currency pairs (sans the CAD). Hurricane Irma is looking like it will hit Florida with Category 4 winds on early Sunday, and will then plow it's way through the entire state through the day and into Monday.
The damage in the hurricane's path could keep an already more cautious Fed on the sidelines. Fed's Dudley sorta said as much today. Although he remains upbeat down the road and about the economy in general ("Economy might be gathering strength a bit"), he also acknowledged the near term data will likely show lower growth from the hurricane effect, but stronger growth down the road (from the hurricane rebuild effect). All of which will make the data hard to interpret.
The US bond market is placing it's bet as 10 and 30 year yields fell to the lowest level of the year and lowest since November 2016.
Of course yields might also be influenced by fears of more N. Korea nuclear and/or missile tests this weekend. It is a holiday on Saturday, and we know how they like to flex their military artillery on such days. Hopefully it is in some parade, vs via a launch over Japan or toward Guam. Weekend risk.
Whatever,the reason, the lower yields are helping to keep a lid on the US dollar. We will see how the sentiment is after the impact of the hurricane in Florida, and potential storm in N. Korea work their way out over the weekend.
So what are some of the main technical themes for some of the major pairs as we close the week?
EURUSD
The EURUSD high this week stalled just ahead of the 38.2% of the move down from the 2011 high. That level comes in at 1.20968. The high reached 1.2092 today. Key level above. If we start to see the price move through 1.2000 and then the 100 hour MA (at 1.1956 currently and moving higher), there could be some further downside. If on the other hand, the price moves above the 1.2042 (201 swing low), then 1.2069 (high from August 29) and 1.20968 (38.2% retracement), the buyers remain in control. The trend is still intact.
USDJPY
The high corrective price in the USDJPY in the NY session reached 108.07. The significance? Look back to April and you will see the swing low stalled at 108.12. The low in August stalled at 108.24. Yesterday, the price took a look-see below the low but closed higher. Today we fell below it, corrected up to it and stayed below it. That says to me, "Bearish". That voice can say "Bullish in the new week, but it will take a move back above that 108.12 level. If not 107.48 (swing high from July 2016) is a target. Under that the 61.8% of the move up from 2016 low comes in at 106.52. Watching 108.12 in the new week.
GBPUSD

The GBPUSD - in early August moved above a trend line (see red circles) and stayed above for 3 days before falling back down. The price today approached that trend line but stalled ahead of it (see chart above). On Monday, that line will come in at 1.3232. Get above it and stay above it would be more bullish (with the August high the first close target). Stay below it and move below the 1.3125 level (see blue line) and the seller are felling more in control.
EURGBP

The EURGBP's technical story this week was about the 200 hour MA above (see green circles) and the trend line below (see red circles). We are closing near the red circles. A move below would be more bearish in the new week. A bounce off and who knows? Maybe it goes right back up to the 200 hour MA again.
NZDUSD.

Looking at the NZDUSD chart above, I spy a ceiling at 0.7336 (see red circles). Today the pair stalled at that ceiling once again. It is undeniable.
On the downside, the 100 hour MA and the underside of the broken trend line at 0.7236 is target 1 on a move lower. The 100 day MA at 0.7194 s target 2. Those levels will be key on a move lower (get below more bearish).
The battle lines are drawn for that currency pair.
USDCAD

For the USDCAD, looking at the weekly chart above, the 1.21608 is the 50% of the move up from the 2012 low. The week is closing near the level. That level will be the barometer for bullish/bearish in the new week. If stay below the 1.1919 is a downside target.
If the price moves back above (and stays above), a further corrective move higher could develop...
------------------------------------------------------------------------------
That is it from me. Thank you for all your support.
My thoughts and prayers are with all those who have been path of hurricane Irma and will be in the path this weekend.
Like the markets, life does have it's share of ups and down, peaks and valleys, floors and ceilings. This storm - and the one that demolished Houston last week - sent and will send a lot of people to a valley.
When support is hit in trading, you get bounces. The hurricane will have lots of people, looking for that bounce. It may not retrace 100% for a while, but build from the 38.2% retracement, get through the 50% and before you know it, you might just have that full retracement.
Peace and prayers to all in hurricanes Irma's sites, and to all who are looking for that retracement in their lives..

