Learn more about chart indicators and which is best suited for your trading October 19
If you have been trading for long, you'll know the torrent of technical data sent by analysts, companies, and even other traders. Experienced traders have various ways of wading through this overwhelming amount of information, however novice ones are likely to become overwhelmed. What is support, what is resistance? - is the fall in the price of a trading instrument a retraction or a full-blown reversal of a trend?
Learn how to trade with
the chart indicators
Luckily for both novice and experienced traders, chart indicators can help them interpret and maybe even obtain a deeper understanding of the movements of markets, instruments and even sentiment. Here's how to use chart indicators to interpret the market.
What are Chart Indicators
If you have the price chart of a specific commodity, share or currency pair open in front of you, then you will see obviously the title and timespan the chart covers, the candlesticks (the "body" of the candlestick indicating open and close price and the "wicks" showing the lows and highs of the price) and finally depending on the chart various lines delineating various areas of the chart.
These lines of delineation are Chart Indicators - depending on the type they can show averages, highs/lows, reversals, breakouts and maxes. Some claim to give you the ability to know when to enter and exit a trade via the price breaking through the limits defined by the indicator.
The most popular types of chart indicator are:
·Bollinger Bands - probably the most frequently used indicator Bollinger band as the name indicates, bands an area of the chart between two prices, which are assumed to be the utmost support and resistance, levels.
·MACD - this is a method of using the moving average of two moving averages to extrapolate early trends and reversals of trends.
·Moving Averages - this is a simple single line indicator, which as the name indicates is averages out the price movement of an instrument, under the premise that this will allow traders to see developing trends.
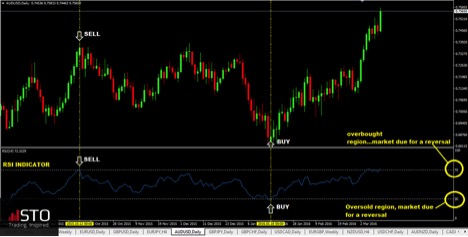
·RSI - also known as relatively strength index this indicator shows when the price of an instrument is in the overbought area - showing the potential for a reversal and if the indicator shows the instrument in oversold and due for an uptrend.
·OBV - the abbreviation for "on balance volume" this indicator shows the buying or selling pressure put on the price of an instrument, a sentiment tool which can help you recognize trends early.
.jpg)
STO also offers its traders a slew of chart indicators, included for free with any of our top tier accounts:
·Mini Chart - this allows you to open a mini chart within your trading environment with a predefined timeframe and instrument. You can also cross-implement this tool with Heinkin Ashi and Three Line Break indicators.
·Pivot Points - This displays crucial pivots in the instruments price level including opening, closing, lows and high levels.
·Highs and Lows - this tool shows historic highs and lows but also allows you to display multiple indicators in one window. This indicator can also be set up to send a notification if an instrument crosses either a historic high or low.
·Renko Bars - superimposes Renko bars on your MT4 chart within a user-specified timeline range.
·Chart Group - by connecting charts you can change instruments across all of them. If you have multiple positions open you can see them on multiple time ranges and set up groups of charts to see the information you feel is the best.
·Symbol Info - this convenient drag and drop window displays info like percentage change day to day, current price compared to previous highs and lows, use multiple user defined indicators across multiple timeframes.
·Gravity - this tool displays speculated support and resistance against the instrument's last price action. It also allows you to define charts by color giving you the ability to see stronger or weaker correlations.
·Chart - in - Chart - view multiple charts within the main active chart in your interface. You can also use the same instrument but set different indicators on each, to see its movement in a different context.
·Magnifier - zoom in on specific sections of your MT4 terminal, creating a completely custom and user-defined time-range.
·Order History - this shows your order history, an invaluable tool, especially when you open or have opened multiple positions. This tool also creates bands which indicate your previous position's opening.
·Freehand drawing - press D and move your mouse to create a graphic overlay on the chart you have open. This is especially helpful for traders that present webinars or that are trader leaders.
·Bar Changer - you can modify chart bars with this tool and also create an offline chart. You can exclude certain low activity hours and is cross compatible with other EAs and indicators to create a completely user-defined terminal interface.
·Keltner Channel - much like Bollinger Bands but with varying sized channels not based on standard deviation. Setup this indicator to inform you when a instrument's price breaks through the upper or lower limit.
·Donchian Channel - an indicator that gives you the ability to use variants on the last N highs and lows. Setup this tool as a SD or ATR multiplier or magnify the percentage of high/low range. Also sends notifications for important levels and price movements.
·Candle Countdown - Define the timeframe and watch as the bar reaches its end. You can even set it up so it sends you a notification as the end of the candlestick approaches. A great tool for day traders.
.jpg)
Why Chart Indicators
Chart indicators can help you understand and contextualize complex and constantly variable information but keep in mind there is a caveat. You may use an elaborate combination of Chart indicators to implement your trading strategy - but is also necessary to be dynamic and adapt to unforeseen market fluctuations.
None-the-less Chart Indicators are valuable tools in any serious trader's toolbox.
This article comprises the personal view and opinion of the STO Investment Research Desk and at no time should be construed as Investment Advice.

