Imports last week at the lowest in 7 years
The imports to the US from Saudi Arabia dropped to the lowest level in 7 years according to data from the EIA last week. According to Bloomberg, the average over the last 6 weeks have fallen by 34%. The fall is crucial for oil prices as storage tanks have been full and help to keep the price of oil lower. If supply can be sopped up, it could lead to a pick up in prices.
Of course Saudi exports to the US is just one piece of the puzzle for crude oil prices. There are production from other OPEC and non-OPEC nations. The US production itself is relevant as well. Although rig counts last week dipped, they have been steadily increasing. The lower cost of oil may be weighing on incremental rigs. However, if oil prices rise as a result of lower supplies (and it is perceived as more permanent), that may restart the rig drilling plans once again (click here for the full article)..
Of course , the technical price picture helps to sift through all the variables that go into the witches brew.

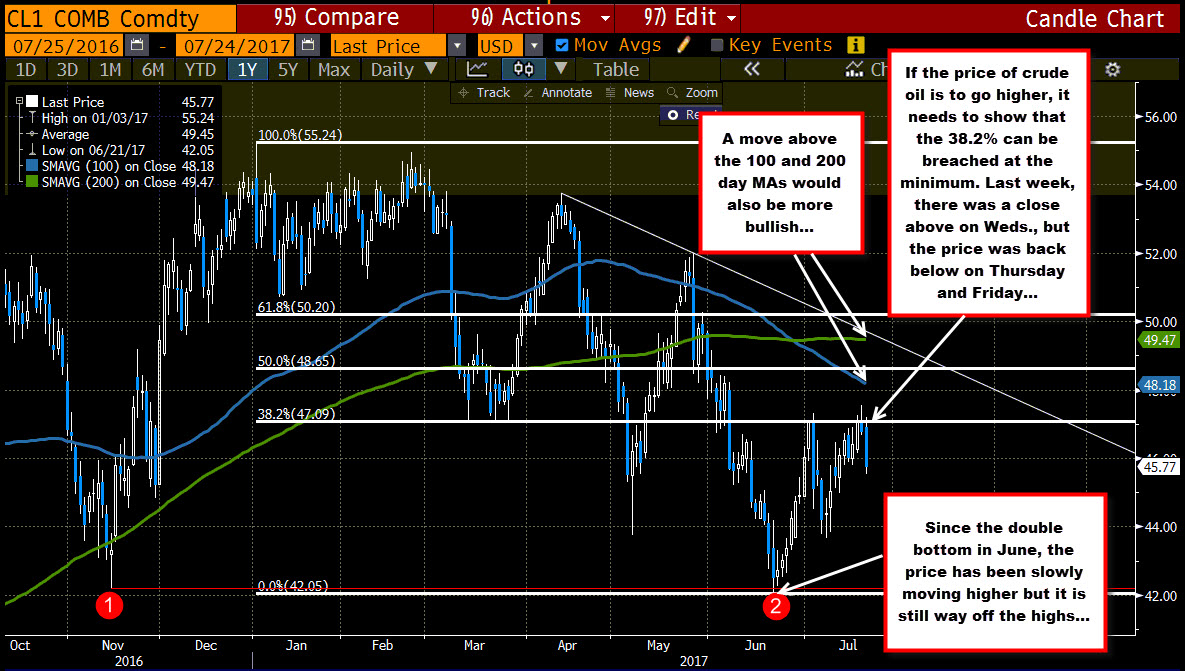
Looking at the daily chart of the Crude oil, since the June low at $42.05, the price has modestly risen (see chart above). Last week, the price reached its highest level since June 7th at $47.55. That move pushed the price above the 38.2% of the move down from Jan 2017 high at $47.09. That was the 2nd look above that retracement target (on July 5th it also moved above), but like the previous look, the break failed (on Wednesday it closed above at $47.12, but closed back below the target on Thursday and Friday).
If the Saudi export data to the US is to make an impact on prices, we should see the price start to trade above that minimum correction line at $47.09 and even work above the 100 and 200 day MAs at 48.18 and $49.47 respectively (blue and green lines in the chart above). The 38.2% is the minimum technical hurdle.
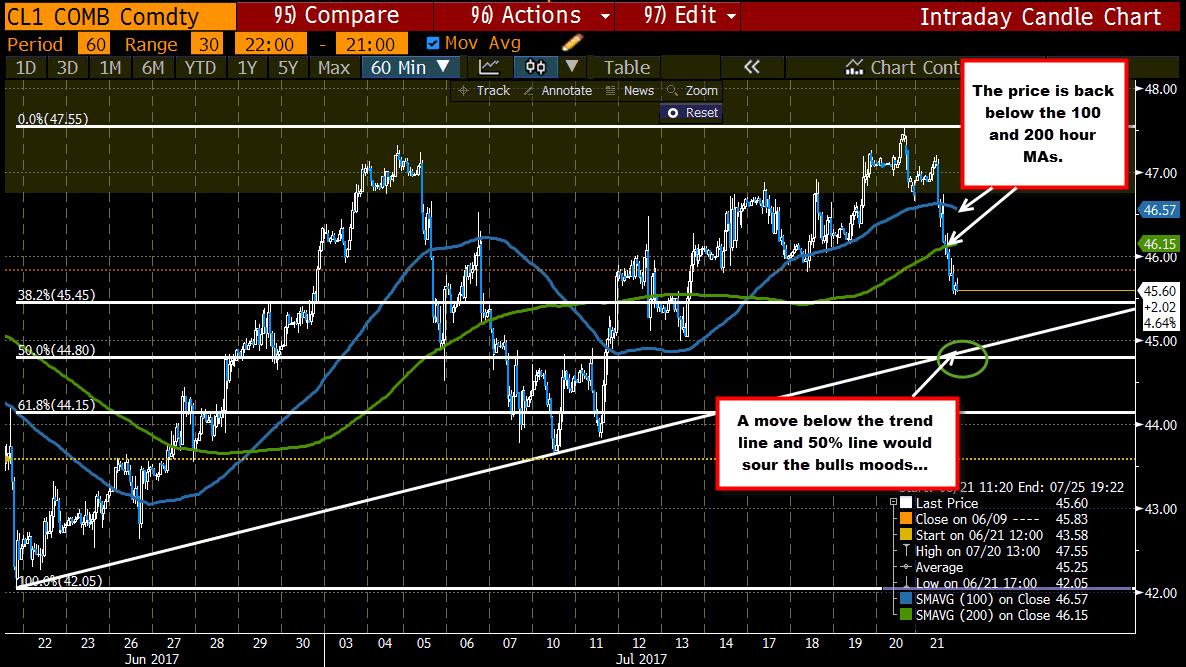
Drilling to the hourly chart (see chart below), the price decline on Friday sent the price back below its 100 and 200 hour MA lines at $46.57 and $46.15 respectively. If the price action technically is to turn more bullish, a move back above those MA lines will be eyed.
Where do the buyers give up fully?
A lower trend line and 50% of the move up from the June low cut across at around the $44.80 area. Staying above keeps buyers interested, but a move below should sour their mood.
SUMMARY: The cut in exports is one piece of puzzle and it is important, but the price action reflects the full picture. On Friday, the dip below the 100 and 200 hour MA and the failure to stay above the 38.2% retracement on the daily chart, puts a damper on the bullish idea. The price action could turn around, the broken levels to the downside, could be rebroken to the upside. That would turn the beat around, but we need to see it. Then the story makes more sense.


