
The 1.2976 break was also key.
The 1.3000 level was a key technical level for the USDCAD. That level stalled the rallies on March 5th and on March 7th. The break today was an invitation for buyers. The price raced higher.
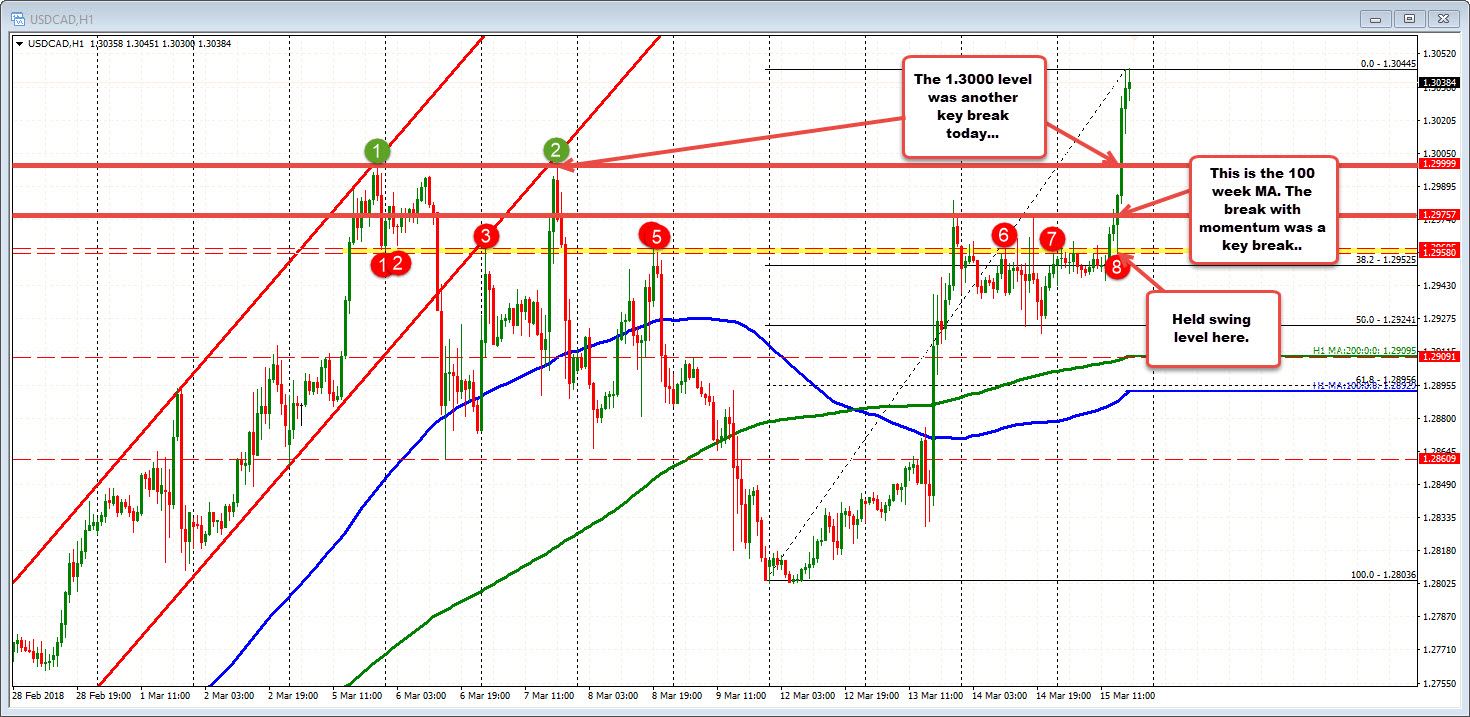
What was resistance now becomes support (risk). Traders will use that level to define and limit risk now.
What also helped and gives more of a bullish bias for the USDCAD is what happened on the weekly chart (see chart below).
The 100 week moving average comes in this week at 1.2976. The price action today moved up to test that MA (see hourly chart). Eased off to a swing level (see hourly), then cracked higher. That break and the subsequent break of the 1.3000 level were the 1-2 punch needed for the momentum buying.
A close above the 100 week MA this week will be the first since June 4, 2017.
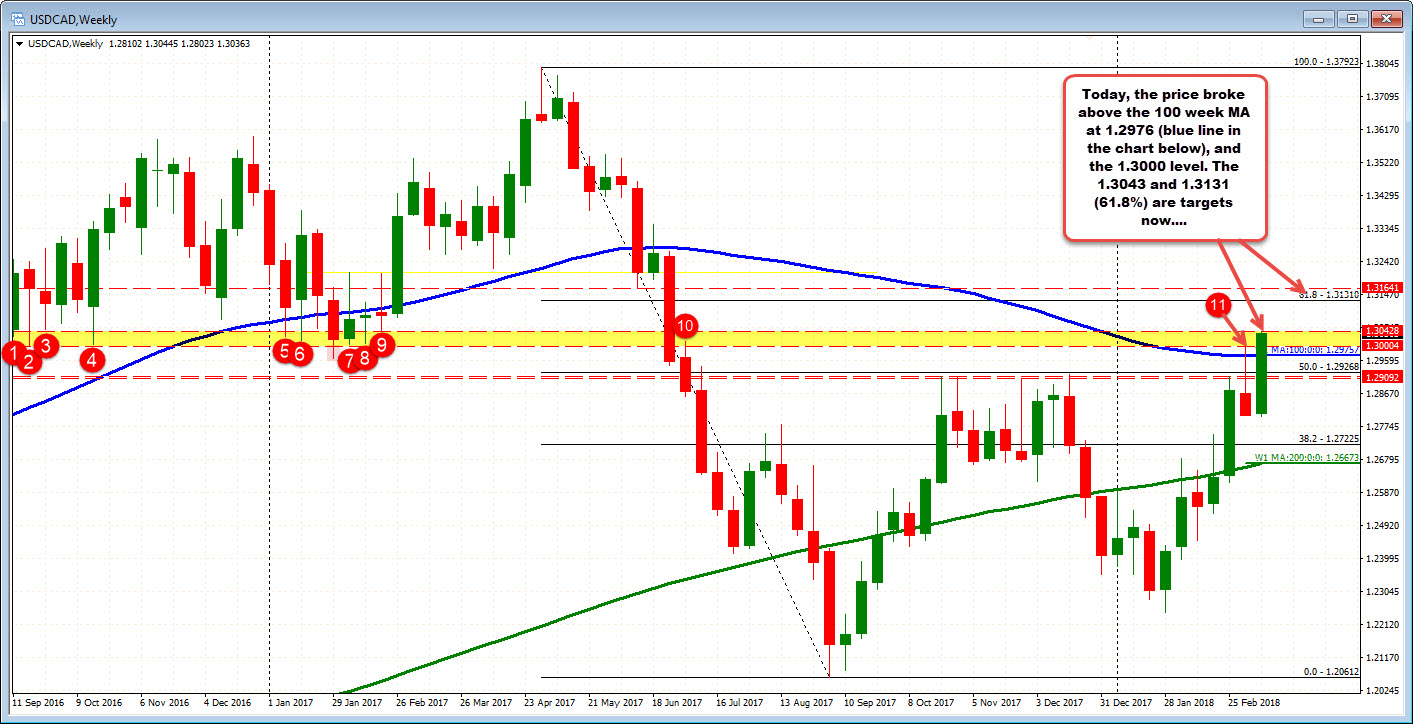
The price on the weekly chart is now testing a high swing area at 1.30428 (moving above as I type - 8 month highs). The 61.8% at 1.3131 is the next target on the topside (from the weekly chart).
Drilling to the daily chart. the pair is in a channel with a topside trend line coming in around the 1.3131 retracement level. Another trend line cuts across at 1.3170 now (See red circles).
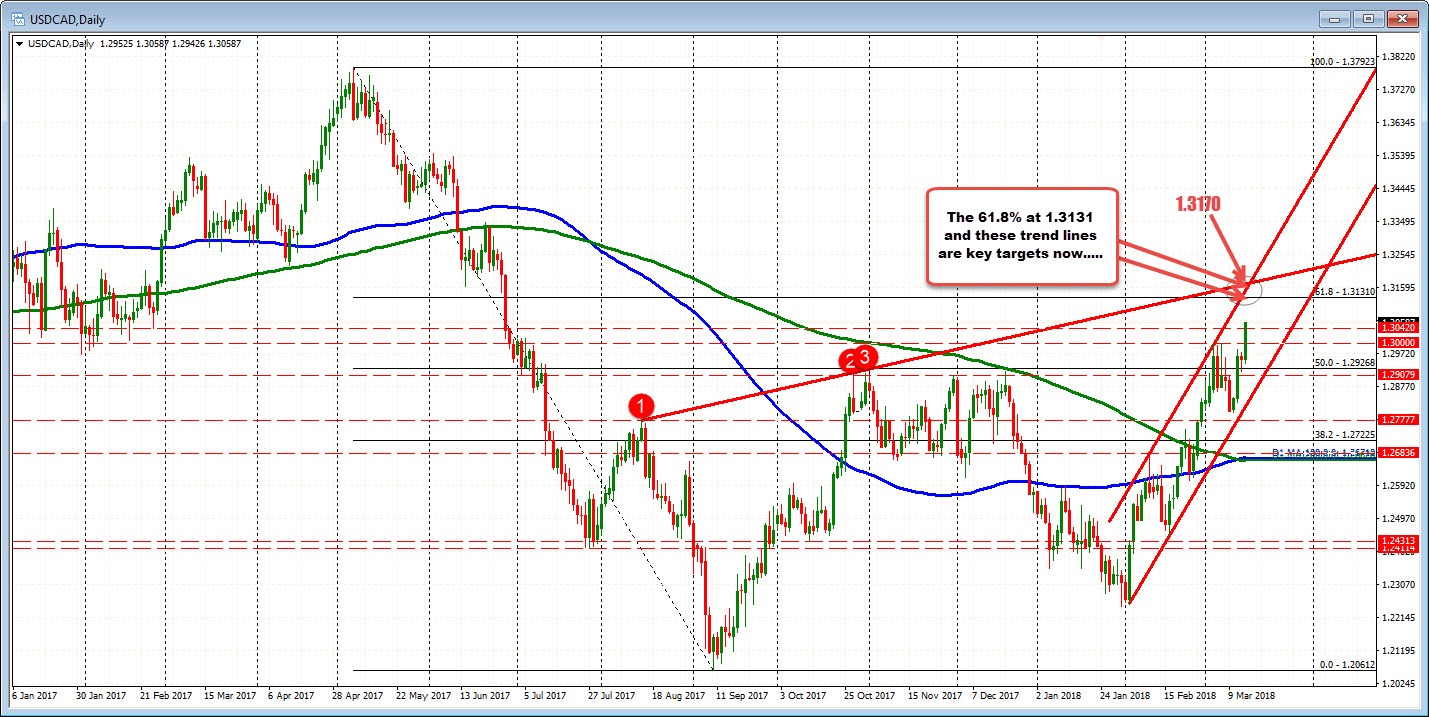
Buyers are in control - and breaking - for a couple key technical reasons today. Stay above the 1.3000 level. Stay above the 100 week MA at 1.2976 are key for the bulls now and going forward.

