Learn more about moving averages and which is best suited for your trading October 12
As a new trader it's easy to become overwhelmed by all the trading jargon, this series of articles seek to demystify some frequently used terms when trading FX and CFDs. The article will cover moving averages, which is a type of chart indicator. All chart indicators attempt to take past price actions, digest them and help traders interpret said data and speculate on future instrument movements.
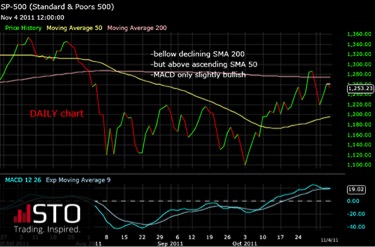
Learn how to trade with the right moving average
Moving averages function by "smoothing" out a chart's candlesticks movements. This helps simplify and emphasize potential patterns or the development of said patterns. Not all moving averages are created the same though...the smoother the moving average i.e. the bigger the period calculated into the equation, the slower its reaction time to a price change as it literally averages out over a longer period.
As the name indicates a moving average indicator is calculated by taking a specific timeframe, adding the instrument's prices and then dividing by the amount of prices you added.
To illustrate:
(Closing or Opening Price A + Closing or Opening Price B + Closing or Opening Price C + Closing or Opening Price D + Closing or Opening Price E) ÷ 5
This would be a 5-SMA since it takes 5 previous sessions into consideration.
This how to start calculating the so-called Simple Moving Average or in trading lingo: SMA. If you repeat this multiple times and connect the averages, then you have a moving average. This indicator is good for short-term contextualization of price movements or market sentiment and not necessary a tool that will allow you to predict future price actions.
Types of SMA and their Application
There are a few very popular moving averages 5 SMA, 10 SMA, 50 SMA and 200 SMA - the number is the amount of trading sessions you are adding and then dividing (see above example, it takes prices A through E and then divides by 5). Each type of SMA is applicable for different trading styles or strategies and as mentioned previously the smoother the average (i.e. the larger the number) the bigger the lag behind the movement of the price. Now let's look at how each SMA is used.
Types of SMAs
5 SMA - extremely responsive but extremely short-term scope. Its average only takes into consideration 5 previous sessions, thus it is extremely 'short-sighted' compared to other SMA of other duration.
10 SMA - this moving average is the mid-point for short position traders, taking into consideration the 10 previous trading sessions, a happy medium for intraday traders and swing traders.
20 SMA - This is likely where the moving average stops being useful for short position traders, the 20 SMA starts displaying the emergence of primary trends.
50 SMA - This can help discern mid-range trends.
200 SMA - Many traders use this moving average to see the change in direction of a long-term trend, if the price level dips below the average it could potentially indicate towards a bearish trend, if it extends above there is a possibility of a bullish trend.
There are further "divisions" i.e. 40 and 151 SMA to mention a few, but the aforementioned are the most widely used.
As you can see the applicability of SMA's really depends on your trading style and strategy. The great thing is that these indicators can be adapted for both long and short position traders, due to its simplicity it can also be used for multiple types of charts and instruments. You may also combine other chart indicators with SMA's to discern the information you feel is the most important.
To avoid finding your positions over or under the market, the best way to use moving averages is by looking for strong trends upwards or downwards. You can also use multiple SMA's to get a unique perspective or use their crossovers as points of data extrapolation. Remember to use the correct timeframe SMA depending on your trading strategy and your intent to open long or short positions.
Overall these are used to determine the strength or inertia of a trend, not necessarily the future of an instrument's price. This is purely mathematical, the average of a price will even out multiple figures, but an average cannot be projected to extrapolate the next figure in the sequence. STO gives you access to MT4 one of the industry leading trading platforms and offers you 12 MT4 compatible EAs to use with it.
This article comprises the personal view and opinion of the STO Investment Research Desk and at no time should be construed as Investment Advice.

